Die wichtigsten Erkenntnisse:
- Retail Analytics wird strategisch, wenn sie Verkaufs-, Marketing- und demografische Daten miteinander verbindet, um geografische Nachfragemuster sichtbar zu machen
- Standortentscheidungen erfordern mehrere Datendimensionen, nicht einzelne Metriken; die Kombination von Kundenfrequenz, Kaufkraft und Wettbewerbsdichte ergibt ein vollständiges Bild
- Ein strukturiertes Bewertungsrahmenwerk verhindert teure Immobilienfehler, die durch Bauchgefühl oder unvollständige Informationen entstehen
- Häufige Fallstricke sind übermäßiges Vertrauen auf historische Verkaufsdaten, die Vernachlässigung von Kannibalisierungsrisiken und die Gleichbehandlung aller Märkte
- Umsetzbare Analytics bedeutet priorisierte Regionen und konkrete nächste Schritte zu liefern, nicht nur Dashboards voller Diagramme
Die meisten Retail-Marken sitzen bereits auf einer Fülle von Daten. Verkaufszahlen, Werbeleistung, Kundenbestellungen, regionale Demografie. Das Problem ist selten ein Mangel an Informationen. Es fehlt die Synthese. Diese Signale leben in Silos -- jedes erzählt einen Teil der Geschichte, aber sie fügen sich nie zu einem kohärenten geografischen Bild zusammen, das zeigt, wo als Nächstes gewachsen werden sollte.
Dieser Artikel untersucht, wie Retail Analytics über das reine Reporting hinausgehen und zu echter Standortberatung werden kann -- um Ihnen zu helfen, Regionen zu bewerten, gängige Fallen zu vermeiden und ein wiederholbares Rahmenwerk für Expansionsentscheidungen aufzubauen.
Das Problem: Daten ohne strategischen Weg nach vorn
Ihre Marke sammelt wahrscheinlich Retail-relevante Daten aus einem Dutzend Quellen. Shopify zeigt Ihnen, wohin Bestellungen verschickt werden. Google Ads zeigt, woher Klicks kommen. Ihr CRM zeigt Kaufhäufigkeit nach Region. Zensusdaten informieren über Einkommen und Haushaltszusammensetzung.
Einzeln betrachtet sind diese Signale nützlich. Zusammen könnten sie Ihnen exakt zeigen, wo Sie als Nächstes eröffnen sollten, wo Sie in Marketing investieren und wo Sie zurückfahren sollten. Aber ohne bewusste Synthese stehen die meisten Marken vor denselben Herausforderungen:
- Hohe Online-Nachfrage in einer Region garantiert nicht, dass ein physischer Store dort floriert
- Marketing-Impressions führen nicht immer zu realen lokalen Besuchen oder Käufen
- Regionen mit bestehender Retail-Präsenz können überversorgt sein, während Gebiete mit hohem Potenzial unsichtbar bleiben
- Viele Marken verschieben Expansionsentscheidungen und warten darauf, dass ihre Analytics "reif" werden, obwohl sie mit dem richtigen Rahmenwerk früher handeln könnten
Die Kosten falscher Standortentscheidungen sind erheblich. Anders als eine Marketingkampagne, die Sie pausieren können, oder eine Preisstrategie, die Sie anpassen können, bindet ein Mietvertrag Sie für Jahre. Das macht die Einsätze bei Standort-Analytics grundlegend anders als bei anderer Business Intelligence.
Arten von Standort-Analytics, die Expansionsentscheidungen vorantreiben
Nicht alle Analytics sind gleich nützlich für Standortentscheidungen. Das Verständnis der verschiedenen Ebenen hilft Ihnen, ein vollständiges Bild aufzubauen, statt sich auf eine einzelne Metrik zu verlassen.
Nachfrage-Analytics
Nachfrage-Analytics beantworten die Frage: Wo zeigen Menschen bereits Interesse an Ihrer Marke oder Kategorie? Diese Ebene umfasst Online-Bestelldichte, Store-Locator-Suchvolumen, E-Mail-Anmeldungen nach Geografie und Werbeengagement nach Region. Nachfragesignale sind der direkteste Indikator dafür, wo bereits Pull existiert.
Für einen tieferen Einblick, wie Sie Nachfragesignale aus Ihren bestehenden Kundenkontaktpunkten erfassen und interpretieren, lesen Sie unseren Einsteigerleitfaden zu Consumer Analytics im Einzelhandel.
Demografische und sozioökonomische Analytics
Das sind die Marktgrundlagen: Bevölkerungsdichte, Altersverteilung, Haushaltseinkommen, Bildungsniveau und Kaufkraftindizes. Demografie hilft Ihnen zu verstehen, ob eine Region das richtige Kundenprofil für Ihre Marke hat -- unabhängig davon, ob diese Kunden Sie bereits entdeckt haben.
Kundenfrequenz- und Mobilitäts-Analytics
Kundenfrequenz-Daten zeigen, wie sich Menschen tatsaechlich durch ein Gebiet bewegen. Sie zeigen Fußgängerströme in der Nähe potenzieller Standorte, Besuchshäufigkeit bei konkurrierenden Standorten und saisonale Muster, die die Retail-Performance beeinflussen. Marken, die Kundenfrequenz-Daten für Competitive Intelligence nutzen, verschaffen sich einen erheblichen Vorteil beim Verständnis nicht nur davon, wer in einem Gebiet lebt, sondern wie sich diese Menschen darin verhalten.
Wettbewerbsdichte-Analytics
Das Verständnis der Wettbewerbslandschaft ist essenziell. Wie viele direkte Wettbewerber operieren innerhalb eines bestimmten Einzugsgebiets? Ziehen nahegelegene Ankermieter die richtige Art von Laufkundschaft an? Ist der Markt gesättigt oder gibt es echte Lücken? Wettbewerbsdichte-Analytics verhindern, dass Sie in Märkte eintreten, in denen das Angebot ähnlicher Produkte die lokale Nachfrage bereits übersteigt.
Performance-Benchmarking-Analytics
Wenn Sie bereits mehrere Standorte betreiben, schafft der Vergleich ihrer Performance mit den Merkmalen ihrer Einzugsgebiete eine leistungsstarke Feedback-Schleife. Welche demografischen Profile korrelieren mit Ihren leistungsstärksten Filialen? Welche Kundenfrequenz-Schwellenwerte trennen starke von schwachen Standorten? Diese Benchmarks werden zu Ihren Standortauswahl-Kriterien.
Wenn Sie eine Plattform suchen, die Besucherfrequenz, Kundendaten und Marktintelligenz an einem Ort vereint, ist Mapulars Consumer Analytics für den Einzelhandel genau dafür gebaut.
Ein Bewertungsrahmenwerk für Standortentscheidungen aufbauen
Rohe Datenebenen sind notwendig, aber nicht ausreichend. Was Analytics in Handlung verwandelt, ist ein strukturiertes Bewertungsrahmenwerk, das Standorte vergleichbar und Entscheidungen transparent macht.
Schritt 1: Definieren Sie Ihr ideales Standortprofil
Beginnen Sie damit, zu beschreiben, wie ein starker Standort für Ihr spezifisches Format aussieht. Das ist keine generische Retail-Weisheit. Es ist ein Profil, das aus Ihren eigenen Performance-Daten kombiniert mit Marktmerkmalen aufgebaut wird. Berücksichtigen Sie:
- Mindestbevölkerung innerhalb eines definierten Fahrzeit-Einzugsgebiets
- Einkommensschwellen, die zu Ihrem Preisniveau passen
- Vorhandensein komplementärer Retail-Ankermieter
- Akzeptable Wettbewerbsdichte-Spanne
- Erreichbarkeits- und Sichtbarkeitsanforderungen
Schritt 2: Legen Sie Ihre Datenquellen übereinander
Sobald Sie ein Standortprofil haben, kombinieren Sie Ihre Datenquellen, um jede Kandidatenregion zu bewerten. Der effektivste Ansatz umfasst mindestens drei Datentypen:
- First-Party-Nachfragesignale (wo Ihre Kunden bereits sind)
- Drittanbieter-Demografiedaten (ob der Markt zu Ihrem Profil passt)
- Wettbewerbs- und kommerzieller Kontext (wie die Landschaft vor Ort aussieht)
Zonen mit starken Nachfragesignalen UND überdurchschnittlicher Kaufkraft, aber wenigen konkurrierenden Retail-Präsenz sind besonders interessant. Gebiete mit hohen Marketingausgaben, aber flacher Conversion-Performance hingegen werden zu Warnsignalen, die näher untersucht werden sollten.
Schritt 3: Regionen bewerten und einordnen
Erstellen Sie ein Scoring-System, das jeden Faktor entsprechend Ihren Prioritäten gewichtet. Manche Marken gewichten Nachfragesignale stark, weil sie dort expandieren möchten, wo bereits Pull besteht. Andere gewichten Demografie stärker, weil sie neue Märkte betreten, in denen die Markenbekanntheit noch gering ist.
Entscheidend ist Konsistenz. Jede Region sollte anhand derselben Kriterien bewertet werden, wodurch der Vergleich einfach wird und der Einfluss individueller Voreingenommenheit oder anekdotischer Eindrücke reduziert wird.
Schritt 4: Mit Vor-Ort-Realität validieren
Analytics verengen das Feld, aber sie ersetzen nicht Standortbesuche und lokales Wissen. Nutzen Sie Ihre bewertete Shortlist, um zu priorisieren, wo Sie Zeit in die Vor-Ort-Validierung investieren. Dazu gehört der Besuch des Einzugsgebiets, die Bewertung von Sichtbarkeit und Erreichbarkeit, Gespräche mit lokalen Immobilienmaklern und das Verständnis der qualitativen Faktoren, die Daten allein nicht erfassen können.
Für Marken, die im Franchise-Modell operieren, passt dieses Bewertungsrahmenwerk eng zu den Best Practices der Standortwahl für Franchise-Wachstum, wo standardisierte Territory Packs und konsistentes Scoring Transparenz für Franchisenehmer und Zentrale gleichermaßen schaffen.
Häufige Fallstricke bei Retail-Standort-Analytics
Selbst Marken mit starker Datenpraxis tappen in Fallen, wenn sie Analytics auf Standortentscheidungen anwenden. Das Erkennen dieser Muster hilft, teure Fehler zu vermeiden.
Fallstrick 1: Übermäßiges Vertrauen auf historische Verkaufsdaten
Vergangene Verkaufsleistung zeigt Ihnen, wo Sie erfolgreich waren, nicht wo Sie erfolgreich sein könnten. Marken, die nur auf historische Daten schauen, tendieren dazu, neue Standorte in der Nähe bestehender zu clustern und verpassen völlig neue Märkte, in denen latente Nachfrage besteht, aber nie aktiviert wurde.
Fallstrick 2: Demografie als Schicksal behandeln
Eine Region mit dem richtigen Einkommens- und Altersprofil unterstützt nicht automatisch einen neuen Standort. Demografie beschreibt Potenzial, nicht Gewissheit. Ohne die Überlagerung mit Nachfragesignalen, Wettbewerbskontext und Erreichbarkeitsdaten riskieren Sie die Expansion in Märkte, die auf dem Papier gut aussehen, aber in der Praxis unterdurchschnittlich performen.
Fallstrick 3: Kannibalisierungsrisiko ignorieren
Die Eröffnung eines neuen Standorts zu nah an einem bestehenden kann Ihren Kundenstamm teilen statt zu erweitern. Kannibalisierungsanalysen, die die Überlappung zwischen Einzugsgebieten modellieren, sollten Teil jeder Bewertung sein. Dies ist besonders kritisch für Marken im Wachstumsmodus, die schnell neue Standorte hinzufügen möchten.
Fallstrick 4: Marketing-Performance mit Marktpotenzial verwechseln
Starke Werbemetriken in einer Region könnten eher effektives Marketing als echte Marktnachfrage widerspiegeln. Wenn Sie das Werbebudget zurückfahren und das Interesse versiegt, war das Marktsignal künstlich. Echtes Marktpotenzial besteht fort, auch wenn sich Marketingbudgets verschieben.
Fallstrick 5: Auf perfekte Daten warten
Viele Wachstumsteams stagnieren mit der Aussage "Unsere Analytics sind noch nicht so weit." Die Realität ist, dass perfekte Daten nicht existieren. Worauf es ankommt, sind konsistente, erklärbare Daten, die innerhalb eines strukturierten Rahmenwerks angewendet werden. Marken, die auf Perfektion warten, verlieren Standorte an Wettbewerber, die auf Basis guter Informationen handeln.
Von Daten zur Richtung: Wie Mapular Retail-Standortentscheidungen unterstützt
Ihr Ziel ist nicht Analytics um der Analytics willen. Sie wollen handeln: eröffnen, testen, Partnerschaften eingehen. Genau so positioniert Mapular Standort-Analytics -- als produktisierten Service statt als Tool, das Sie selbst aufbauen oder pflegen müssen.
Der Prozess folgt drei Schritten:
Verbinden Sie Ihre Daten
Sie teilen Verkaufsdaten von Shopify oder Ihrer Commerce-Plattform, Werbeleistung von Meta und Google sowie alle First-Party-Signale wie Store-Locator-Nutzung oder CRM-Geografie. Mapular reichert diese mit demografischen und regionalen Marktindikatoren wie Kaufkraft, Bevölkerungsdichte und Wettbewerbskontext an.
Analyse durchführen
Mapular analysiert die Überlappung auf Quartiersebene zwischen Ihrer Zielgruppenreichweite, Conversion-Stärke und Marktpotenzial. Die Analyse identifiziert geografische Muster, deren manuelle Aufdeckung Wochen dauern würde, und bringt Regionen ans Licht, in denen mehrere positive Signale zusammenlaufen.
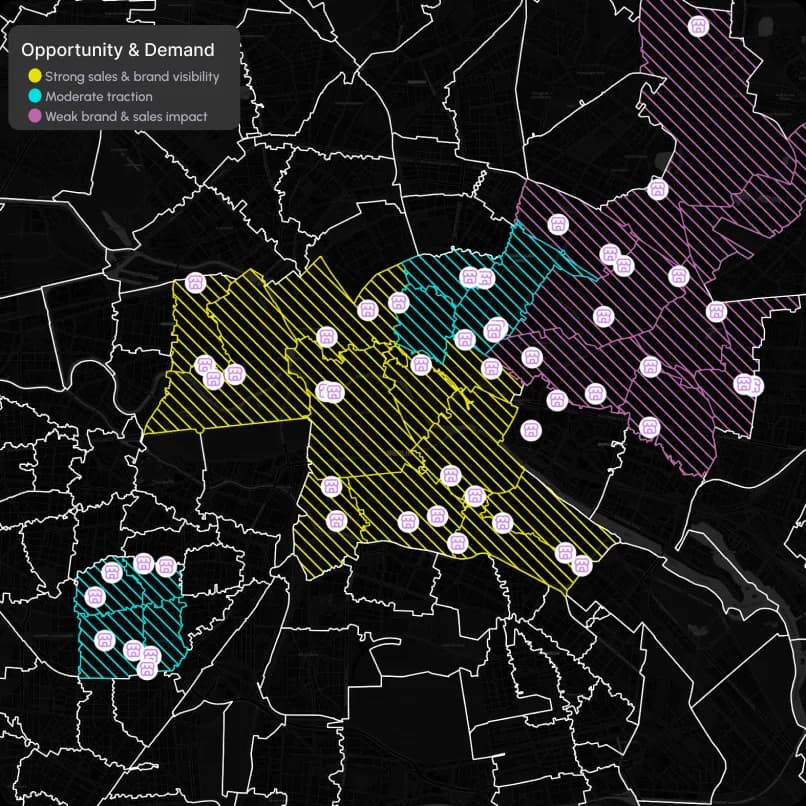
Wachstumskarte liefern
Sie erhalten eine visuelle Karte plus priorisierte Postleitzahlen oder Postzonen, die zeigen, welche Regionen weitere Erkundung verdienen und welche geringere Priorität haben. Statt eines weiteren Dashboards zum Überwachen erhalten Sie Erkenntnisse, auf die Sie sofort handeln können.
Eine Marke, die mit uns zusammenarbeitet, fasste den Ansatz zusammen: "Wir haben jetzt den Beweis, welche Gebiete unter dem Radar liegen, statt zu raten, wo sie sind."
Warum das mehr zählt als Dashboards allein
Dashboards zeigen Ihnen, was in vergangenen Monaten passiert ist. Wachstumskarten weisen auf das hin, was als Nächstes zu versuchen ist. Dieser Unterschied ist wichtig, weil Standortentscheidungen von Natur aus zukunftsorientiert sind. Sie wählen nicht, wo Sie gewesen sein wollten; Sie wählen, wo Sie sein werden.
Eine einzelne Metrik wie Werbeausgaben kann Standortpotenzial nicht in den richtigen Kontext setzen. Ebenso wenig eine einzelne Datenebene wie Demografie. Der Wert von Retail Analytics für Standortentscheidungen entsteht durch die Kombination mehrerer Signale zu einer kohärenten geografischen Ansicht, die Unsicherheit reduziert und Ihre Expansionsressourcen fokussiert.
Fazit
Retail Analytics muss kein langfristiges Projekt oder ein komplexes System sein, das aufgebaut werden muss. Es kann ein fokussiertes, räumliches Insight-Tool sein, das Sie nutzen, um Regionen intelligenter zu bewerten und mit Zuversicht voranzugehen.
Die Marken, die am effizientesten wachsen, sind diejenigen, die Standortentscheidungen mit derselben analytischen Rigorosität behandeln, die sie auf Produktentwicklung oder Marketing-Optimierung anwenden. Sie schichten ihre Daten, bauen konsistente Bewertungsrahmenwerke, lernen aus ihren Fallstricken und handeln auf synthetisierter Intelligenz statt auf isolierten Signalen. Für eine Schritt-für-Schritt-Anleitung, wie Sie diese Analyse in einen umsetzbaren Wachstumsplan verwandeln, lesen Sie wie Sie das Retail-Wachstum für nächstes Jahr mit Nachfragedaten planen.
Wenn Sie Ihre Daten in richtungsweisende Klarheit verwandeln möchten, erkunden Sie Retail Opportunity Mapping und finden Sie heraus, welche Regionen Ihren nächsten Schritt verdienen.