Key Takeaways:
- The world's forests are counted through a formal reporting chain: countries measure, then report to FAO's Global Forest Resources Assessment, to the UN climate convention, and, if they seek results-based payments, under REDD+
- The binding constraint is not satellite data, which is free and abundant, but expert interpretation time: national teams visually check thousands of sample plots per reporting cycle to produce statistically defensible numbers
- A map is not a report. Global tree-cover maps do not translate directly into "forest" under FAO or national definitions, and the statistics that count come from probability samples, not from counting pixels
- FAO's Open Foris tools (SEPAL, Collect Earth Online, FERM) are free, open source, and already the operational backbone in much of the world
- Under results-based climate finance, uncertainty literally costs money: crediting standards apply deductions that scale with the uncertainty of the reported estimate
- AI helps most exactly where the bottleneck is: pre-labelling sample plots, routing only uncertain cases to humans, and keeping a provenance trail that makes every reported figure auditable
Forests cover roughly 4 billion hectares, about a third of the world's land. Between 2015 and 2020 around 10 million hectares were deforested every year, partly offset by regrowth and planting elsewhere. Those numbers steer billions in climate finance and national policy, so it is worth asking a naive-sounding question: who actually counts, and how?
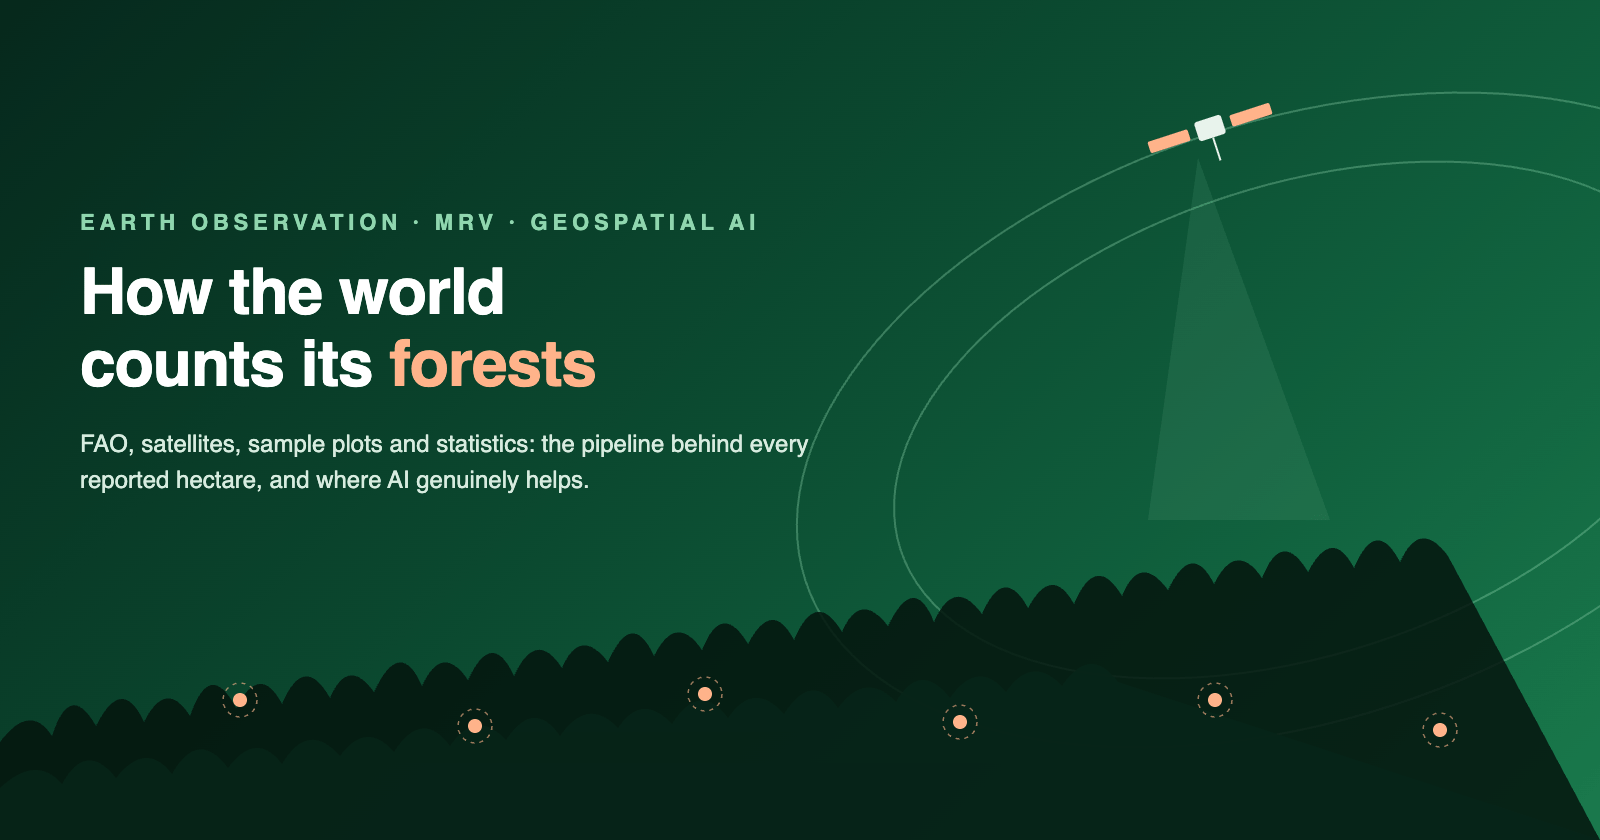
The answer is a pipeline that runs from satellites through sample plots and human interpreters to statistics, coordinated to a remarkable degree by one UN agency. This article walks that pipeline end to end. It is the reference we wished existed when we started building systems in this space.
Who counts: FAO and the reporting chain
The Food and Agriculture Organization of the United Nations (FAO) has been taking stock of the world's forests since 1948. Its Global Forest Resources Assessment (FRA) compiles country reports on forest area, change, growing stock and management roughly every five years; FRA 2020 covered 236 countries and territories, with the well-known headline figures of 4.06 billion hectares of forest and a net loss of 4.7 million hectares per year over the preceding decade.
FRA is one of three destinations in the reporting chain, and understanding the difference between them explains most of how the system behaves:
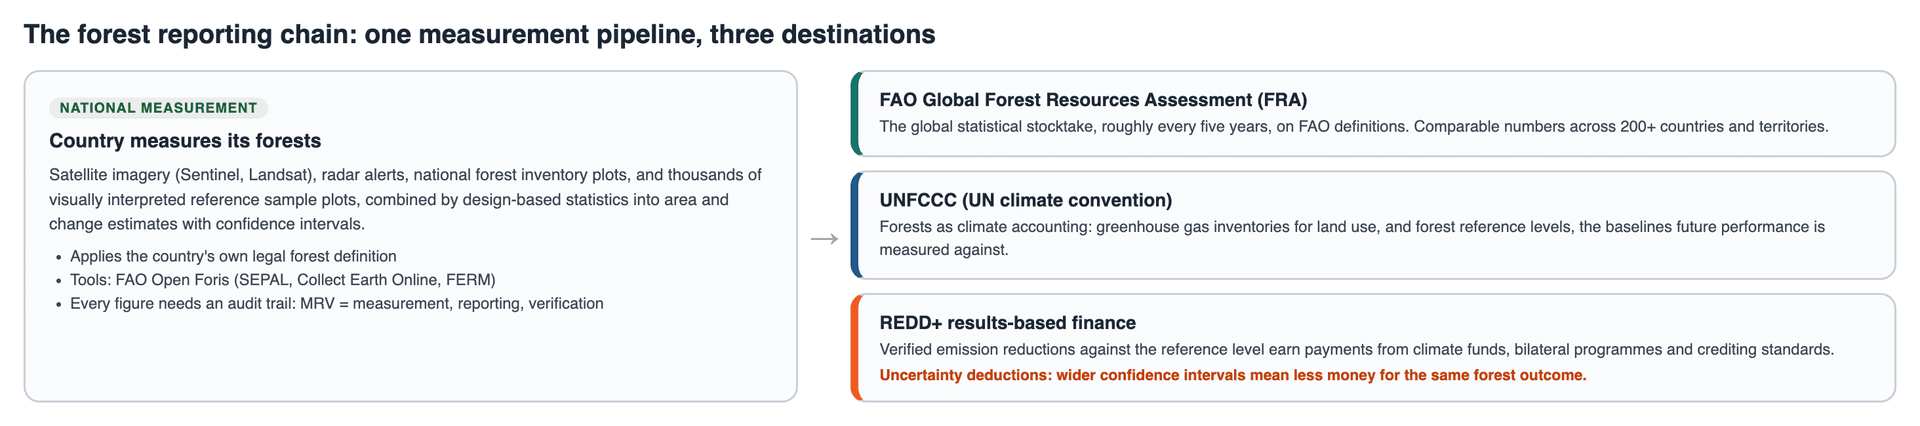
FRA is the statistical stocktake: comparable numbers across every country, on FAO's definitions.
The UNFCCC, the UN climate convention, is where forests become climate accounting. Countries report greenhouse gas emissions and removals from land use, and those that want to be paid for reducing deforestation first submit a forest reference level: a baseline of historical emissions against which future performance is measured.
REDD+ (reducing emissions from deforestation and forest degradation) is where the money is. Countries that demonstrate emission reductions against their reference level can receive results-based payments, from the Green Climate Fund, from bilateral programmes, or through crediting standards that sell the verified reductions into carbon markets.
The three destinations share one measurement chain, and the chain has a name you will meet everywhere in this field: MRV, for measurement, reporting and verification. The verification part is not decoration. Every number a country reports can be challenged by a technical assessment, and under crediting standards, by auditors whose findings determine payment.
What counts as a forest? Less obvious than it sounds
FAO's definition: land of more than 0.5 hectares with trees higher than 5 metres and canopy cover above 10 percent, that is not predominantly under agricultural or urban land use. Read that last clause again, because it carries the whole system. Forest is a land use, not just a land cover. An oil palm plantation can be wall-to-wall trees and still not be forest; a clear-felled production forest that will be replanted is still forest the day after harvest.
National definitions vary within ranges the UNFCCC allows: canopy thresholds between 10 and 30 percent, minimum areas between 0.05 and 1 hectare. Two countries can look at the same landscape and legitimately report different forest areas.
This is why the famous global tree-cover maps, invaluable as they are, do not settle the question. A satellite measures cover; a definition requires use and intent. Bridging that gap is precisely where human interpretation enters the pipeline, and where much of the cost lives.
The data: what satellites actually provide
The raw material is better than it has ever been, and it is free.
Optical imagery. The EU's Copernicus programme flies the Sentinel-2 pair, imaging the entire land surface every five days at 10-metre resolution, and the archive is open. NASA and USGS's Landsat programme provides a continuous record back to the 1970s, which is what makes historical baselines possible at all.
Radar. Optical satellites cannot see through cloud, and the tropics are cloudy for months at a stretch. Sentinel-1's synthetic aperture radar sees through cloud, day and night, which is why radar-based deforestation alerting has become the operational standard in tropical forest monitoring.
Global products built on this data. Landsat-based global forest change maps and alert systems, radar-based alerts for the tropics, and the European Commission Joint Research Centre's tropical moist forest monitoring all provide wall-to-wall change signals. Spaceborne lidar and long-running ESA programmes contribute biomass estimates, with honest and well-documented uncertainties: biomass signals saturate in dense forest, which is why serious carbon accounting anchors on national forest inventories, with maps in a supporting role.
The important structural fact: none of these products is, by itself, a national report. They are evidence. Turning evidence into a defensible number is a separate discipline.
The science: why sample plots beat pixel counting
Here is the part that surprises newcomers. The internationally recognised good practice for estimating forest area and change, the approach recommended in guidance built on work by Olofsson and colleagues and adopted in FAO's own methods, is not to count classified pixels. It is to draw a probability sample of locations, have trained interpreters determine what is actually there at each one, and compute the estimate from the sample, the way an election poll works.
Why? Because maps have systematic errors, and counting their pixels inherits those errors invisibly. A well-designed sample, interpreted carefully, yields an unbiased estimate with a confidence interval, and the confidence interval is what reporting frameworks and auditors require. The map still matters: it is used to stratify the sample, concentrating plots where change is likely, which makes the estimate dramatically more efficient. But the number that gets reported comes from the sample.
The consequence is the industry's real bottleneck. A national reporting cycle can require interpreting thousands or tens of thousands of plots, each one a person looking at imagery time series and deciding: forest or not, under this country's definition, changed or stable, and if changed, to what. It is slow, it is expensive in scarce expert time, and interpreters disagree with each other more than anyone likes to admit, especially on the hard cases: regrowth, agroforestry, degraded but standing forest.
The tools: FAO's Open Foris, the quiet workhorse
FAO did something quietly effective about the tooling problem: it built the tools and gave them away. The Open Foris portfolio is free and open source, and it underpins forest monitoring work across a large share of the world's reporting countries:
- SEPAL puts serious satellite data processing in a browser, backed by cloud compute, so a national team does not need its own cluster
- Collect Earth Online is where the sample-plot interpretation happens: imagery time series side by side, structured forms, multiple interpreters per plot
- FERM tracks ecosystem restoration, the other half of the story as pledges shift from stopping loss to restoring landscapes
- Earth Map, Whisp and others cover contextual analysis and supply-chain screening
For anyone building in this space, the lesson is blunt: countries trust and use these tools. The valuable move is to make them faster, not to replace them.
The money: uncertainty is a line item
Results-based finance turned measurement quality into a financial variable. Crediting standards for jurisdictional REDD+ apply uncertainty deductions: the wider the confidence interval on a reported emission reduction, the more is withheld. A country that tightens its estimates, by better sampling, better interpretation consistency and better audit trails, receives more money for the same forest outcome.
This is worth dwelling on, because it changes what "good" means. In most mapping work, accuracy is a quality attribute. In MRV, the confidence interval is part of the product, and everything that feeds it, who interpreted which plot, with which imagery, deciding what, must survive third-party scrutiny years later. A measurement system is an analysis with a memory.
Where AI actually helps, and where it should not
The current wave of AI lands on this field in three distinct ways, and they deserve different levels of enthusiasm.
Foundation models for Earth observation are genuinely new. ESA and IBM's open-source TerraMind model, trained on aligned multimodal satellite data, leads independent benchmarks across land cover and change tasks, and ESA's Major TOM project has published open, globally complete embeddings of the Sentinel archives. For the sampling problem, embeddings are a gift: they make "find me places that look like this" cheap, which improves stratification, and they make models label-efficient, which matters in a field where labels are the expensive thing.
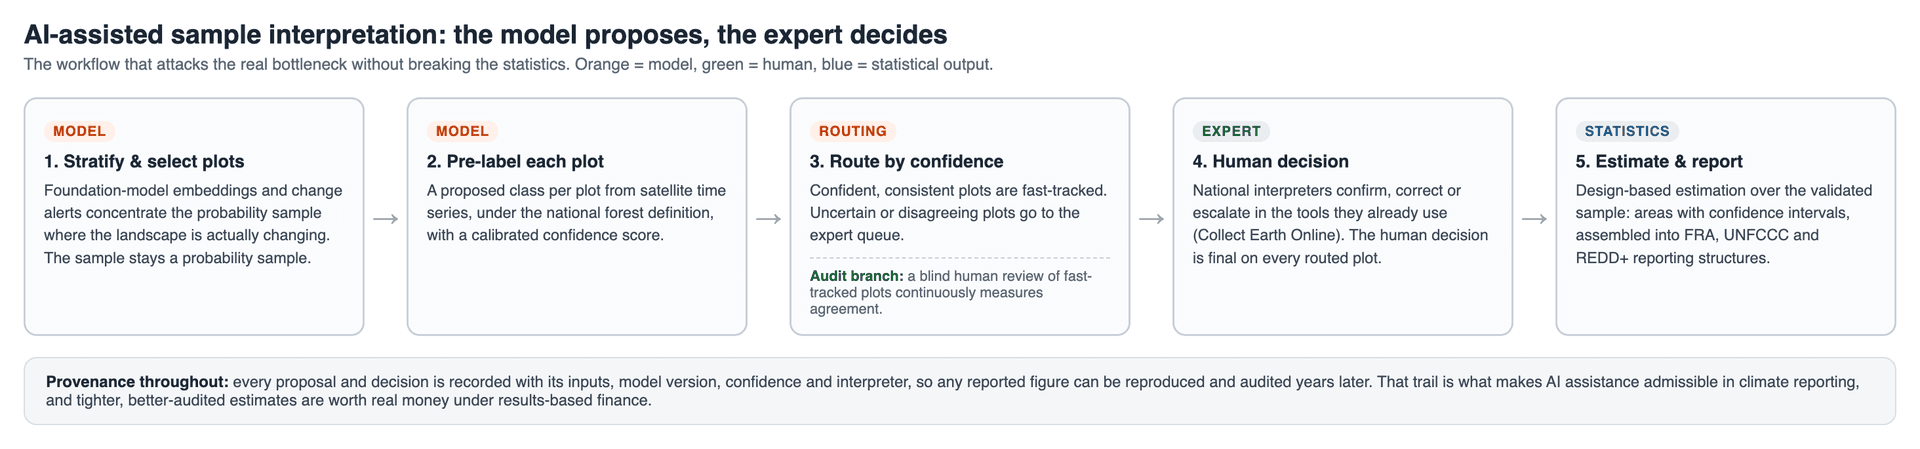
AI-assisted interpretation is where the bottleneck actually yields. A model can pre-label every sample plot with a calibrated confidence score; plots where the model is sure and consistent can be fast-tracked, and human experts concentrate on the genuinely hard cases. Done properly, with the probability sample left intact and a blind-review audit of the fast-tracked plots, this cuts expert workload substantially while keeping the statistics valid. Done carelessly, it quietly breaks the estimator, which is why the design details are not optional.
Full automation is the thing to resist. An unauditable machine label has no standing in a UNFCCC submission or a crediting audit, and the interpreter's judgment on land use, on intent, on the difference between a harvested plantation and a deforestation event, is the step that connects pixels to definitions. The right architecture keeps the human decision at the statistically material points and records everything: inputs, model version, confidence, human decision, timestamp. Provenance is what makes the AI admissible.
Why we care
Mapular builds AI systems for geospatial data: agentic systems that chain models and tools, Model Context Protocol servers that connect AI models directly to geospatial data, and the platforms underneath. We have delivered a forest carbon MRV platform for the carbon markets, built a monitoring platform for UNESCO World Heritage sites, and run field reference data collection at national scale, which is to say we have felt this article's bottlenecks personally.
The forest monitoring stack is one of the clearest cases we know where modern AI, applied with respect for the statistics and the institutions, produces real public value: faster reporting cycles, tighter estimates, more finance flowing to the countries doing the work. If you are working on this problem, from the agency side, the science side or the finance side, we would genuinely like to compare notes. Talk to us.