Die Expansion im Einzelhandel ist eine der folgenreichsten Entscheidungen, die eine wachsende Marke treffen kann. Eröffnen Sie in der richtigen Region, beschleunigen Sie Ihr Wachstum, stärken Handelspartnerschaften und bauen Markenpräsenz dort auf, wo es zählt. Eröffnen Sie in der falschen, verbrennen Sie Kapital, überdehnen Ihre Betriebsstrukturen und verlieren Dynamik, die sich nur schwer wiedergewinnen lässt. Trotz dieser Tragweite treffen viele Marken ihre Expansionsentscheidungen noch immer auf Basis unvollständiger Daten, einiger Anekdoten und einer guten Portion Bauchgefühl. Retail Opportunity Mapping existiert, um dieses Ratespiel durch Klarheit zu ersetzen.
Die wichtigsten Erkenntnisse
- Signale für die Einzelhandelsexpansion -- darunter E-Commerce-Bestellungen, Anzeigenperformance und demografische Daten -- liegen typischerweise in verschiedenen Plattformen isoliert vor, was es schwierig macht, das Gesamtbild zu erkennen.
- Opportunity Mapping verbindet diese Datenquellen zu einer einzigen geografischen Analyse, die Regionen nach ihrem Wachstumspotenzial bewertet.
- Die Methodik kombiniert Ihre eigenen Performance-Daten mit externen Marktindikatoren wie Kaufkraft, Bevölkerungsdichte und Wettbewerbspräsenz.
- Das Ergebnis ist eine visuelle Wachstumskarte und eine Rangliste der Regionen -- kein weiteres Dashboard zum Überwachen, sondern ein klarer Maßnahmenkatalog, nach dem Ihr Team handeln kann.
- Marken, die Opportunity Mapping einsetzen, reduzieren Expansionsrisiken, verkürzen Planungszyklen und vereinen funktionsübergreifende Teams hinter einer gemeinsamen, datenbasierten Sicht auf Wachstumschancen.
Das Problem
Signale für die Einzelhandelsexpansion sind häufig verstreut. Shopify-Bestellungen befinden sich in einem Dashboard. Meta- und Google Ads-Performance in einem anderen. Demografische Daten kommen von einem Drittanbieter. Feedback von Handelspartnern trifft per E-Mail ein. Jede Datenquelle erzählt einen Teil der Geschichte, aber keine davon zeigt allein, wo Ihr nächster Standort am besten performen wird.
Das Ergebnis ist ein Planungsprozess, der sich fragmentiert anfühlt. Das Marketing weiß, welche Regionen den stärksten Return on Ad Spend erzielen. Der Vertrieb weiß, welche Einzelhändler sich neue Produkte wünschen. Die Finanzabteilung kennt das Budget. Aber es fehlt eine Gesamtsicht, die diese Perspektiven zu einer kohärenten Wachstumsstrategie verbindet. Ohne diese Verbindung greifen Teams auf das zurück, was sie kennen: die Expansion in Regionen, in denen sie bereits präsent sind, oder das Nachahmen von Wettbewerbern, ohne zu verstehen, ob dieselbe Strategie für ihre eigene Marke funktioniert.
Die Herausforderung für Marken
Wenn Marken den Schritt vom reinen E-Commerce in den stationären Handel machen, müssen sie eine entscheidende Frage beantworten: Wo wird unser nächster Store oder Partnerstandort erfolgreich sein?
Der Erfolg hängt vom Zusammenspiel mehrerer Faktoren ab: ausreichende Verbrauchernachfrage, günstige Demografie, überschaubarer Wettbewerbsdruck und logistische Machbarkeit. Keine einzelne Datenquelle erfasst all diese Dimensionen. Und je weiter eine Marke von ihrem Heimatmarkt expandiert, desto weniger kann sich ihr Führungsteam auf Intuition verlassen.
Ohne eine klare Verbindung zwischen Online-Nachfrage und Offline-Potenzial weichen Expansionsentscheidungen häufig auf fehlerhafte Ansätze aus: dem Wettbewerb in Märkte folgen, in denen er bereits präsent ist; die größten Metropolregionen ansteuern, ungeachtet von Wettbewerb und Kosten; oder mit dem Handelspartner expandieren, der am meisten drängt. Jeder dieser Ansätze kann gelegentlich funktionieren. Keiner funktioniert durchgängig. Für mehr Informationen darüber, wie Marken datengetriebenes Denken auf Standortentscheidungen anwenden, lesen Sie unseren Leitfaden zu Best Practices für die Standortwahl im Franchise-Wachstum.
Das Gesamtbild erkennen
Wenn Ihre Vertriebs-, Marketing- und Regionaldaten miteinander verbunden sind, werden Muster sichtbar. Sie können klar erkennen, wo die kanalübergreifende Performance am stärksten ist, wo Marketingmaßnahmen tatsächliche Besuche generieren und wo potenzielle Kunden noch unterversorgt sind.
Wie es eine Marke, die mit uns arbeitet, formulierte:
"Zum ersten Mal können wir sehen, wo sich unsere Marketing- und Einzelhandelsdaten tatsächlich überschneiden -- und welche Regionen es wert sind, als Nächstes erkundet zu werden."
Die Verknüpfung Ihrer Datenquellen verändert Ihre Wachstumsplanung grundlegend und gibt Ihrem Team eine gemeinsame Entscheidungsgrundlage. Statt darüber zu debattieren, ob in den Südosten oder den Mittleren Westen expandiert werden soll -- basierend auf anekdotischen Hinweisen --, kann Ihr Team eine Rangliste von Postleitzahlengebieten analysieren, in denen Nachfrage, Demografie und Wettbewerbslücken zusammentreffen.
Diese gemeinsame Sicht beschleunigt auch die interne Abstimmung. Wenn Marketing, Vertrieb und Führungsebene auf dieselbe Karte schauen, verändert sich das Gespräch von "Ich denke, wir sollten hier expandieren" zu "Die Daten zeigen, dass diese Region den höchsten Opportunity Score hat." Dieser Wandel reduziert interne Reibungsverluste und verkürzt den Weg von der Analyse zur Umsetzung.
Die Datenquellen hinter Opportunity Mapping
Effektives Opportunity Mapping erfordert die Kombination eigener Markendaten mit externen Marktinformationen. Das fließt in die Analyse ein:
Eigene Daten (First-Party Data)
- E-Commerce-Bestellungen. Die geografische Verteilung der Online-Verkäufe zeigt, wo Ihre Marke bereits Resonanz findet. Regionen mit hoher Bestelldichte, aber geringer Einzelhandelspräsenz, sind erstklassige Expansionskandidaten.
- Anzeigenperformance. Meta, Google Ads und andere Paid-Kanäle liefern geografische Performance-Daten, einschließlich Klickraten, Konversionsraten und Kosten pro Akquisition, aufgeschlüsselt nach Region.
- E-Mail- und CRM-Engagement. Plattformen wie Klaviyo zeigen, wo Ihre engagiertesten Abonnenten konzentriert sind -- ein weiteres Signal für latente Nachfrage.
- Store Locator-Suchdaten. Wenn Sie verfolgen, wo Kunden auf Ihrem Store Locator nach Ihren Produkten suchen, repräsentieren diese Anfragen direkte Kaufabsicht auf geografischer Ebene.
Externe Daten (Third-Party Data)
- Demografische Indikatoren. Bevölkerungsdichte, Haushaltseinkommen, Altersverteilung und Kaufkraftindex helfen einzuschätzen, ob die Bevölkerung einer Region zu Ihrem Zielkundenprofil passt.
- Wettbewerbslandschaft. Zu verstehen, wo konkurrierende Marken im Einzelhandel präsent sind -- und wo nicht --, deckt Lücken auf, die Sie nutzen können.
- Frequenzdaten. Aggregierte Frequenzdaten für Einzelhandelskorridore und Einkaufszentren zeigen, welche Gebiete den Käufertyp anziehen, der wahrscheinlich Ihr Produkt kauft.
- Einzelhandelsinfrastruktur. Die Dichte und Art der Einzelhandelsstandorte in einer Region -- von großen Kaufhäusern bis zu Spezialgeschäften -- bestimmt, ob geeignete Vertriebspartner existieren.
Wie Retail Opportunity Mapping funktioniert
Mapulars Retail Opportunity Mapping verwandelt fragmentierte Daten in eine klare, gewichtete Wachstumskarte. Der Prozess ist unkompliziert und darauf ausgelegt, Ergebnisse innerhalb von Tagen zu liefern -- nicht Monaten.
Schritt 1: Ihre Daten anbinden
Kombinieren Sie Ihre Online-Performance-Daten aus Shopify, Meta und Google Ads über einen einfachen CSV-Export oder -- für laufende Analysen -- über eine API-Anbindung. Wir reichern die Daten mit geodemografischen Indikatoren wie Kaufkraft und Bevölkerungsdichte an. Das Ziel ist es, alle relevanten Signale in einem einzigen, geografisch vereinheitlichten Datensatz zusammenzuführen.
Schritt 2: Wir führen die Analyse durch
Unser Team verarbeitet und analysiert Ihre Daten mit einer Methodik, die jedes Signal entsprechend seiner Relevanz für Ihre spezifischen Expansionsziele gewichtet. Die Analyse identifiziert Regionen, in denen Ihre Zielgruppe, Performance und Marktpotenzial übereinstimmen. Sie markiert auch Regionen, in denen ein oder zwei Signale stark sind, aber andere fehlen -- so können Sie echte Chancen von Trugschlüssen unterscheiden.
Schritt 3: Ihre Wachstumskarte erhalten
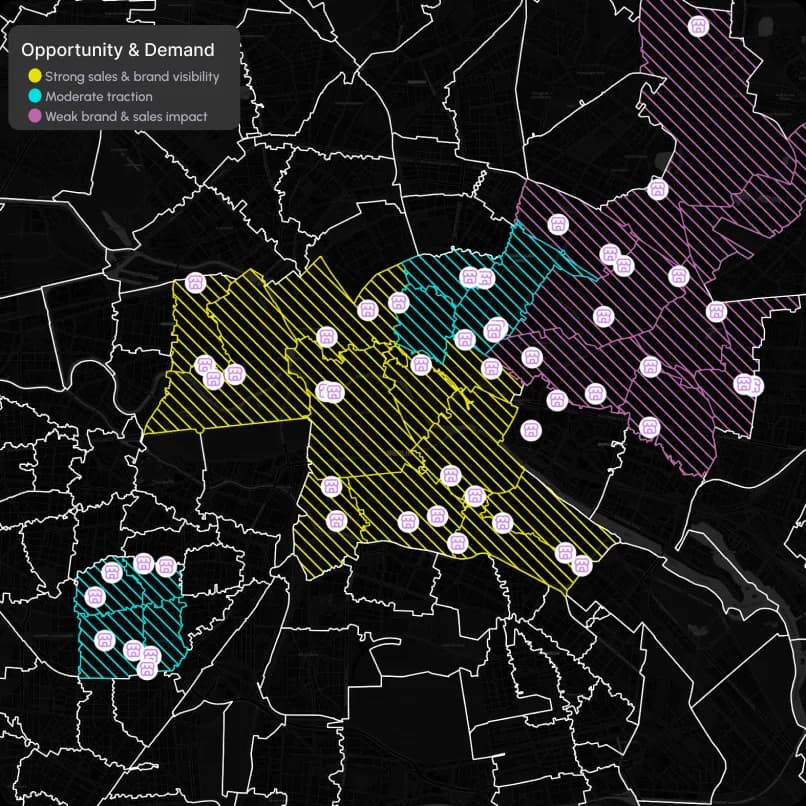
Sie erhalten einen visuellen Bericht, der Ihre leistungsstärksten Regionen hervorhebt, Gebiete mit geringer Einzelhandelsabdeckung relativ zur Nachfrage aufzeigt und konkrete Postleitzahlengebiete benennt, die es sich zu erkunden lohnt. Die Ergebnisse umfassen:
- Eine visuelle Nachfragekarte, überlagert mit Ihrer aktuellen Einzelhandelsabdeckung
- Eine gewichtete Chancenliste auf Postleitzahlenebene
- Eine Analyse des Verhaltnisses von Nachfrage zu Abdeckung, die quantifiziert, wie unterversorgt jede Region ist
- Konkrete Empfehlungen, welche Regionen priorisiert werden sollten und warum
Statt eines weiteren Dashboards zum Überwachen erhalten Sie eine klare, datenbasierte Wachstumskarte, die Ihr Team anleitet, wo eröffnet, getestet oder kooperiert werden sollte. Das Format ist sowohl als PDF für Präsentationen als auch als interaktive Version für tiefergehende Analysen verfügbar.
Praxisbeispiel
Stellen Sie sich eine D2C-Marke aus dem Bereich Lebensmittel und Getranke vor, die national online verkauft, deren Handelspartnerschaften aber auf den Nordosten konzentriert sind. Ihre Shopify-Daten zeigen starkes Bestellvolumen in Texas und im Südosten. Ihre Google Ads-Daten bestätigen hohe Konversionsraten in diesen Regionen. Doch ohne eine strukturierte Analyse bleiben diese Signale nur interessante Datenpunkte.
Durch Opportunity Mapping stellt die Marke fest, dass drei spezifische Metropolregionen in Texas eine Kombination aus hoher Online-Nachfrage, gunstiger Demografie, starker Kundenfrequenz in relevanten Einzelhandelskorridoren und minimaler Wettbewerbspräsenz aufweisen. Die gewichtete Chancenliste gibt dem Vertriebsteam eine klare Zielliste für die Ansprache von Einzelhändlern -- einschließlich Daten zur Unterstützung des Pitches.
Ohne das Mapping hätte die Marke möglicherweise nach Dallas expandiert, einfach weil es der größte Markt ist. Mit dem Mapping entdeckt sie, dass eine mittelgroße Metropole wie Austin oder San Antonio tatsächlich ein besseres Verhältnis von Nachfrage zu Abdeckung und eine günstigere Wettbewerbslandschaft bietet.
Was das für Ihr Team bedeutet
Der Wert von Opportunity Mapping erstreckt sich über die gesamte Organisation.
- Marketing sieht, welche Regionen tatsächlich konvertieren -- nicht nur, wo Impressionen landen. Diese Erkenntnis hilft, Trade-Marketing-Budgets gezielter einzusetzen und regionale Aktivierungen dort zu planen, wo sie die größte Wirkung entfalten.
- Vertrieb weiß, wo neue Partner angesprochen oder die Distribution ausgebaut werden sollte -- ausgestattet mit Daten, die die nachgewiesene Verbrauchernachfrage in jeder Zielregion belegen.
- Führungsebene erhält eine klare, datenbasierte Richtung, wo die nächste Wachstumsphase beginnen sollte -- das erleichtert die Rechtfertigung von Expansionsbudgets und die Festlegung realistischer Ziele.
Es geht nicht darum, Ihre Dashboards zu ersetzen. Es geht darum, die Erkenntnisse zwischen ihnen zu verbinden und diese Verbindungen in eine geografische Wachstumsstrategie zu übersetzen. Für einen tieferen Einblick, wie Consumer Analytics diese Art funktionsübergreifender Entscheidungsfindung unterstützt, lesen Sie unseren Einsteiger-Leitfaden.
Warum Marken einen produktisierten Ansatz wählen
Traditionelle Beratungsaufträge für Marktanalysen können Monate dauern und sechsstellige Summen kosten. Mapulars Retail Opportunity Mapping ist produktisiert: Die Methodik ist standardisiert, die Datenpipelines sind aufgebaut, und Ergebnisse werden in unter 14 Tagen geliefert -- bei Pilotprojekten typischerweise in etwa 5 Tagen. Diese Geschwindigkeit ist entscheidend, weil die Planung der Einzelhandelsexpansion zeitkritisch ist. Marken müssen Listungsentscheidungen treffen und sich innerhalb enger Planungsfenster auf regionale Aktivierungen festlegen. Ein produktisierter Ansatz passt in diese Zeitpläne, ohne auf analytische Sorgfalt zu verzichten.
Jeder neue Markteintritt birgt Risiken. Opportunity Mapping eliminiert dieses Risiko nicht, reduziert es aber erheblich, indem sichergestellt wird, dass Entscheidungen auf Daten statt auf Annahmen basieren. Wenn Sie das Nachfragepotenzial, die Wettbewerbslandschaft und die demografische Passung einer Region quantifizieren können, bevor Sie Ressourcen binden, vermeiden Sie die teuersten Fehler: die Eröffnung in Regionen, in denen sich die Nachfrage nicht materialisiert, oder das Übersehen von Regionen, in denen sie bereits existiert.
Fazit
Die Expansion im Einzelhandel sollte nicht auf Intuition beruhen. Die Daten, die Sie bereits haben, enthalten die Antwort. Sie müssen nur verbunden, strukturiert und durch eine geografische Linse analysiert werden. Retail Opportunity Mapping tut genau das -- es verwandelt verstreute Signale aus Ihrer E-Commerce-Plattform, Ihren Werbekanälen und Marktdaten in eine klare, gewichtete Übersicht, wo Ihre Marke als Nächstes wachsen sollte.
Ob Sie Ihren ersten Schritt in den stationären Handel planen oder einen bestehenden Multi-Regionen-Footprint optimieren -- die Fähigkeit, Nachfrage und Abdeckung auf derselben Karte zu sehen, verändert die Entscheidungsfindung Ihres Teams grundlegend. Sie ersetzt Debatten durch Evidenz, verkürzt Planungszyklen und gibt allen Beteiligten eine gemeinsame Handlungsgrundlage. Für einen praktischen Leitfaden, wie Sie diese Analyse in den Wachstumsplan des nächsten Jahres übersetzen, lesen Sie wie Sie Ihr Einzelhandelswachstum mit umsetzbaren Nachfragedaten planen.


