Die Herausforderung
Der Kunde verwaltet ein Mixed-Use-Portfolio über mehrere europäische Länder: Retail, Büro, Wohnen und Logistik in einem Fonds. Immer wenn das Asset-Management-Team eine Akquisition prüfen, eine Hold-vs-Sell-Entscheidung verteidigen oder einen Portfolio-Review für den Vorstand vorbereiten musste, lief der Workflow gleich ab.
Drei bis fünf verschiedene Berater je nach Geografie beauftragen. Vier bis acht Wochen pro Bericht warten. PDFs erhalten, die unterschiedliche Methoden, Gewichtungen und sogar unterschiedliche Definitionen von "Einzugsgebiet" verwendeten. Eine weitere Woche damit verbringen, die Ergebnisse in vergleichbare Zahlen zu übersetzen. Beim nächsten Objekt von vorn.
Die Kosten dieses Vorgehens waren in der Beratungsposition sichtbar. Das größere Problem war unsichtbar: Objekte wanderten in ihrer Performance, weil niemand verfolgte, wie sich ihre Fundamentaldaten zwischen den Begutachtungen veränderten. Wenn dann ein Refresh kam, war die Antwort meistens "das hätten wir vor sechs Monaten wissen müssen."
Die Lösung
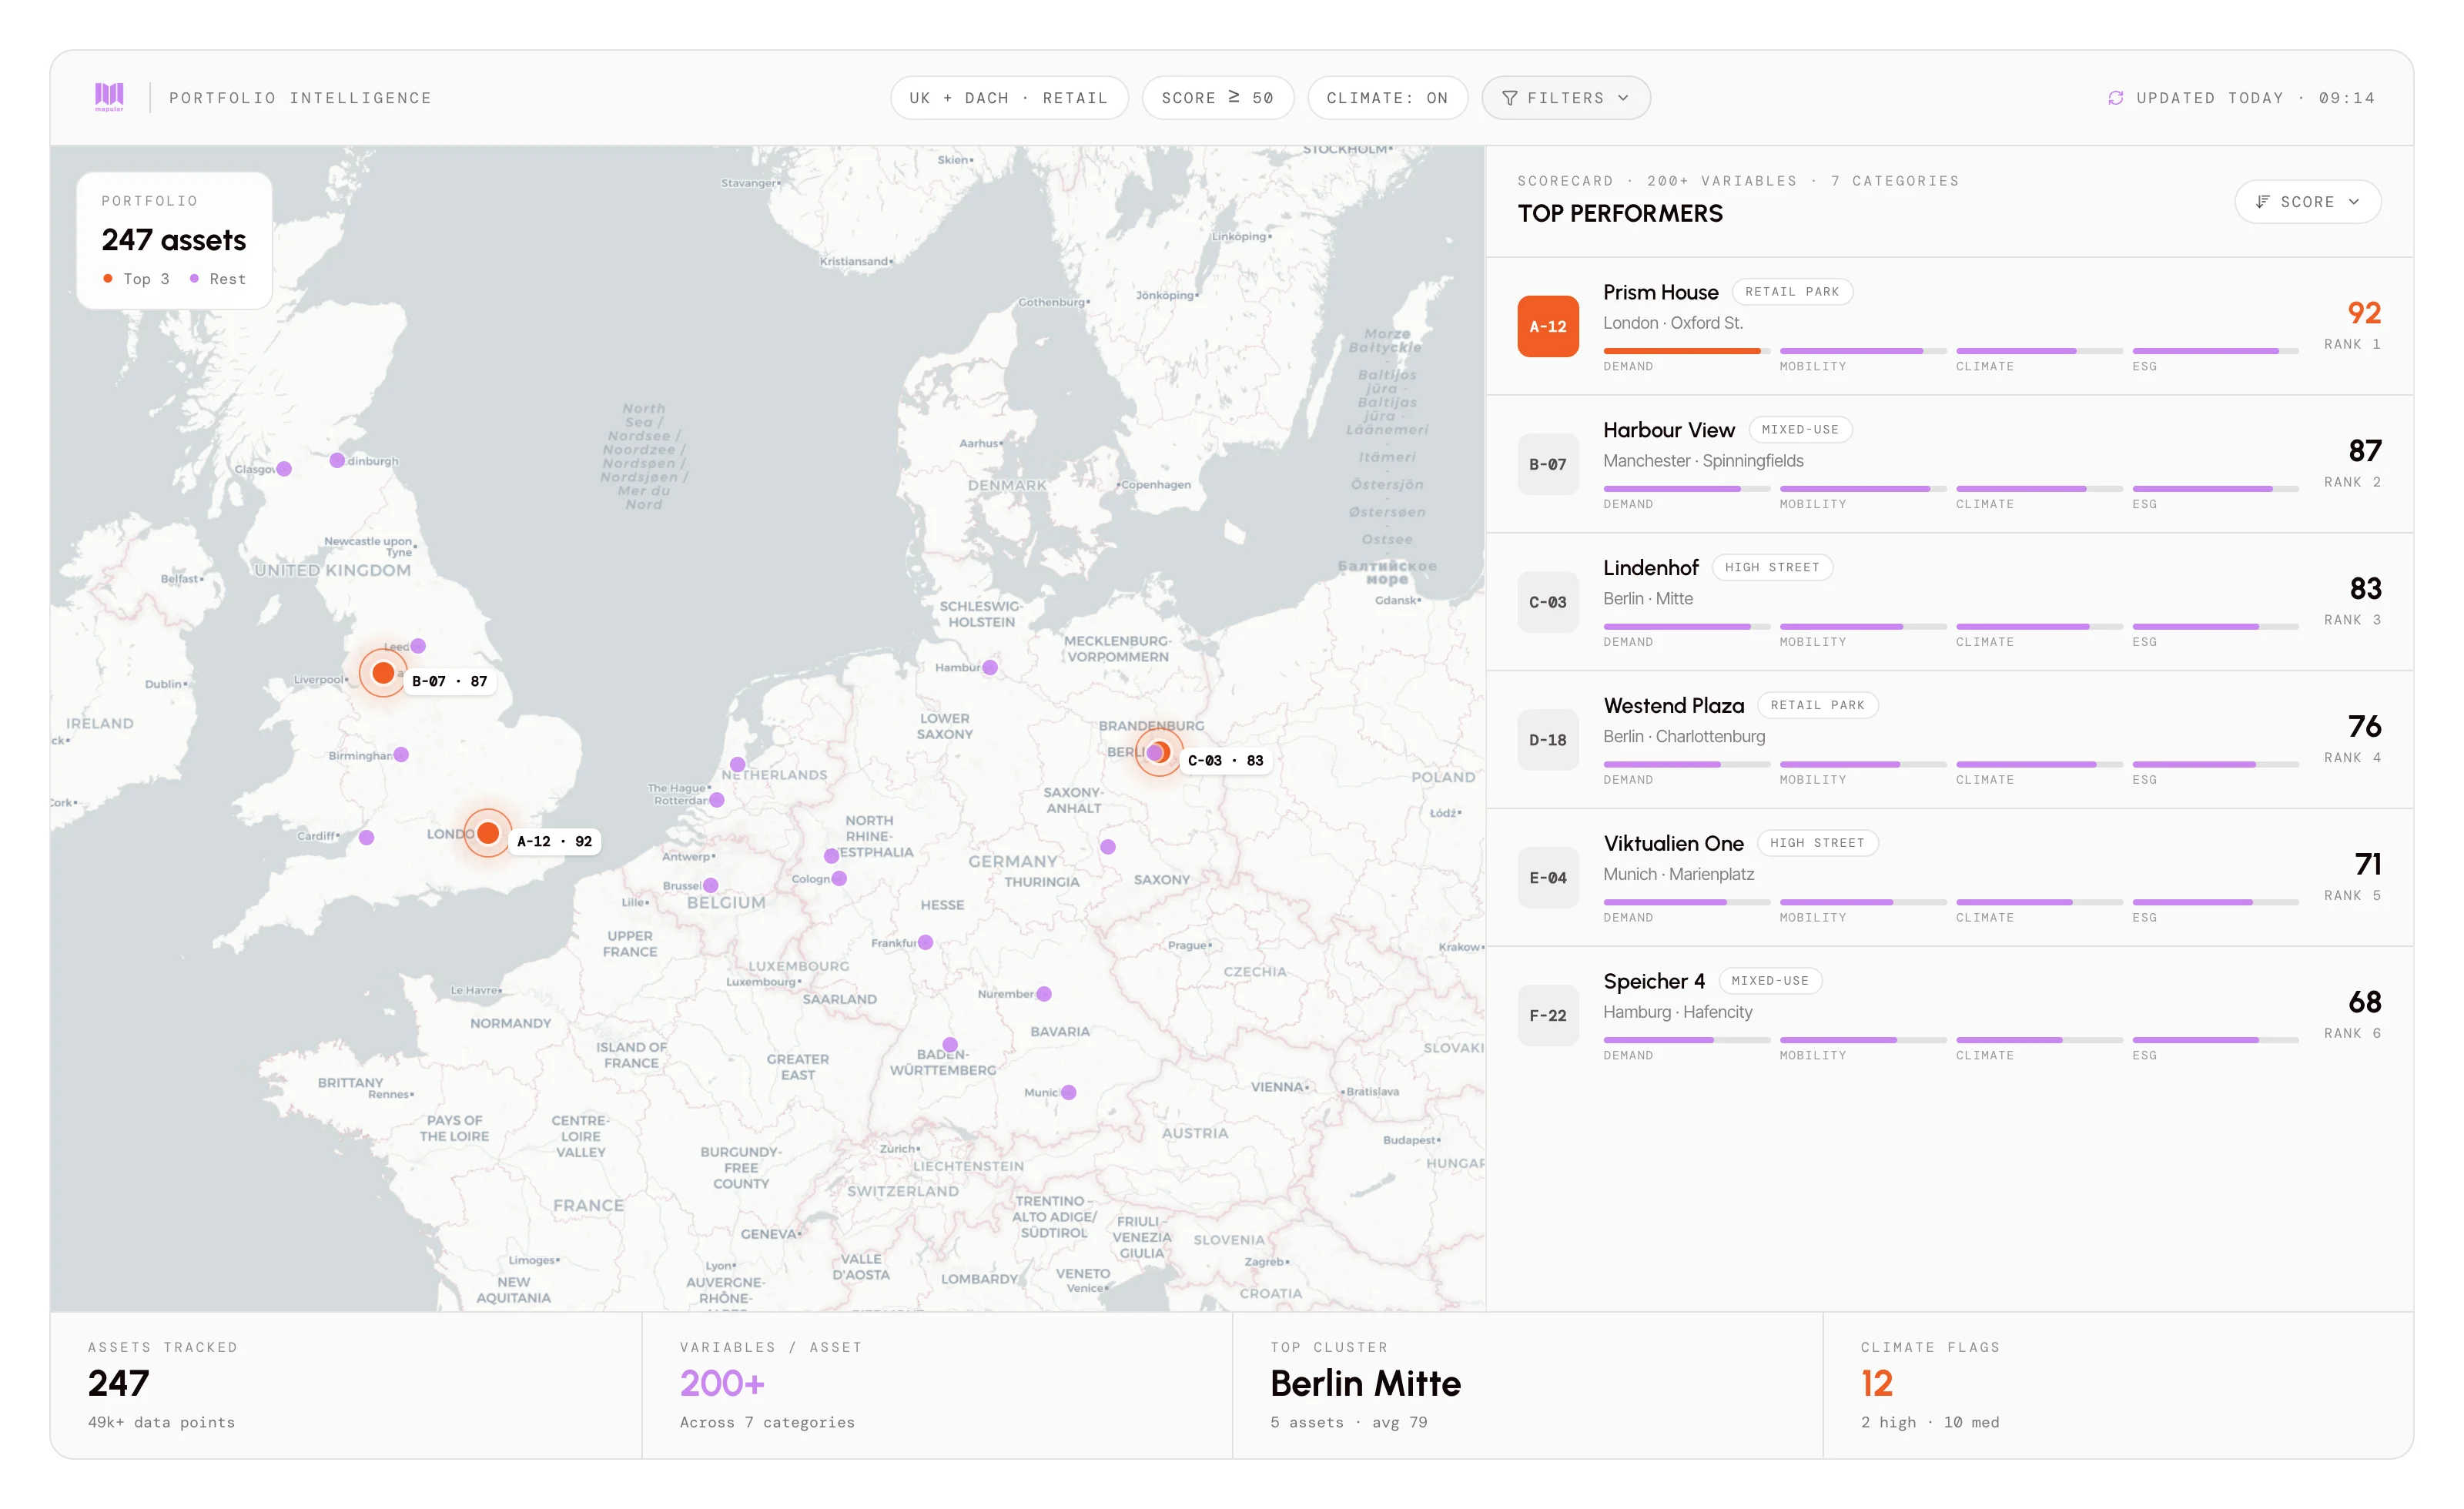
Mapular hat das interne Portfolio-Bewertungstool des Kunden von Grund auf gebaut. Das Tool läuft in der Cloud-Umgebung des Kunden. Seine Objektdaten bleiben dort, wo sie sind. Die angereicherten räumlichen Ebenen von Mapular werden in einem definierten Takt aktualisiert und über die Integrationsschicht zugespielt.
Der Build umfasste den vollen Stack:
- Datenintegration: Konnektoren zur MRI-Installation des Kunden für Objektdaten, Mietverträge, Capex-Pläne und Energie-Performance, plus 200+ räumliche Mapular-Variablen über sieben Kategorien (Demografie und Nachfrage, Mobilität und Erreichbarkeit, Klimarisiko, Energie und ESG, Marktdynamik, gebaute Umwelt, Wettbewerb).
- Bewertungsmodell: Gewichtung gemeinsam mit dem Asset-Management-Team und dem Investment Committee gestaltet. Jede Assetklasse (Retail, Büro, Mixed-Use, Wohnen, Logistik) bekam eine eigene Scorecard. Das Team kann Gewichtungen anpassen, Variablen hinzufügen oder Kategorien neu balancieren, ohne uns einzubeziehen.
- Produktive Dashboards: Portfolio-weite Bewertung, Vergleich von Objekten nebeneinander, Klima- und Transitionsrisiko-Overlays sowie Zeitreihen-Tracking jeder Variable pro Objekt.
- Methodik und Audit-Trail: vollständige Datenherkunft, Bewertungs-Provenance und Quellendokumentation im Tool, damit auf die Vorstandsfrage "Warum dieser Standort?" eine Antwort einen Klick entfernt liegt.
Erste nutzbare Version nach acht Wochen. Produktionsreif mit vollautomatischer Datenaktualisierung in drei Monaten.
Ergebnisse & Wirkung
- Von Tagen auf Minuten pro Standortanalyse. Was vorher ein mehrwöchiger Beraterzyklus war, läuft jetzt als Refresh, der automatisch passiert, sobald sich die Daten ändern.
- Eine vergleichbare Grundlage über das gesamte Portfolio. Jedes Objekt wird nach denselben 200+ Variablen über dieselben sieben Kategorien bewertet, unabhängig von Assetklasse oder Land.
- Bereit für das Investment Committee ab dem ersten Tag. Jede IC-Sitzung beginnt heute mit der aktuellen Scorecard. Diskussionen laufen schneller, weil alle dieselben Zahlen sehen, gleich erzeugt.
- Vorstandsreif in Tagen, wenn eine unerwartete Frage auftaucht (Klimarisiko, EU-Taxonomie-Konformität, Sanierungskosten). Die Methodik ist dokumentiert, die Daten sind integriert.
- Beraterbudget umgeleitet. Das Team nutzt externe Berater weiterhin für tiefe Spezialgutachten. Die wiederkehrende Bewertungsebene, für die Berater bisher Rechnungen schrieben, läuft jetzt intern.
Erkenntnisse
- Ein gemischtes Portfolio braucht vergleichbare Bewertung. Unterschiedliche Berater je Assetklasse produzieren Berichte, die nicht miteinander sprechen. Bewertung auf gleicher Grundlage über das Portfolio ist der Hebel.
- Das Investment Committee verändert, wie das Tool genutzt wird. Sobald eine Scorecard zum Standardausgangspunkt jeder IC wird, fragt das Team nicht mehr "sollten wir ein Gutachten beauftragen", sondern "was sagt die Scorecard."
- Maßgeschneidert heißt anpassbar. Off-the-shelf-Tools zwingen Ihrem Portfolio ihre Methodik auf. Ein Tool, das um Ihren Asset-Mix und Ihre Bewertungs-These gebaut wurde, passt sich an, wenn sich beides verändert.
- Klima und ESG lassen sich nicht nachträglich aufsetzen. Energieausweise, EU-Taxonomie-Konformität und physische Risiko-Variablen gehören vom ersten Tag an in das Bewertungsmodell, nicht in einen nachgelagerten Bericht.