Key Takeaways:
- Mapular Explorer is a browser-based interface to the same harmonised dataset that ships through the GIS/CAD/BI-ready delivery, not a separate, thinner product
- Datasets are organised into browsable categories, ALKIS, ATKIS, Urban Land-Use Planning, Risk & Zones, Elevation & 3D, and Demographics, each with per-region completeness shown up front
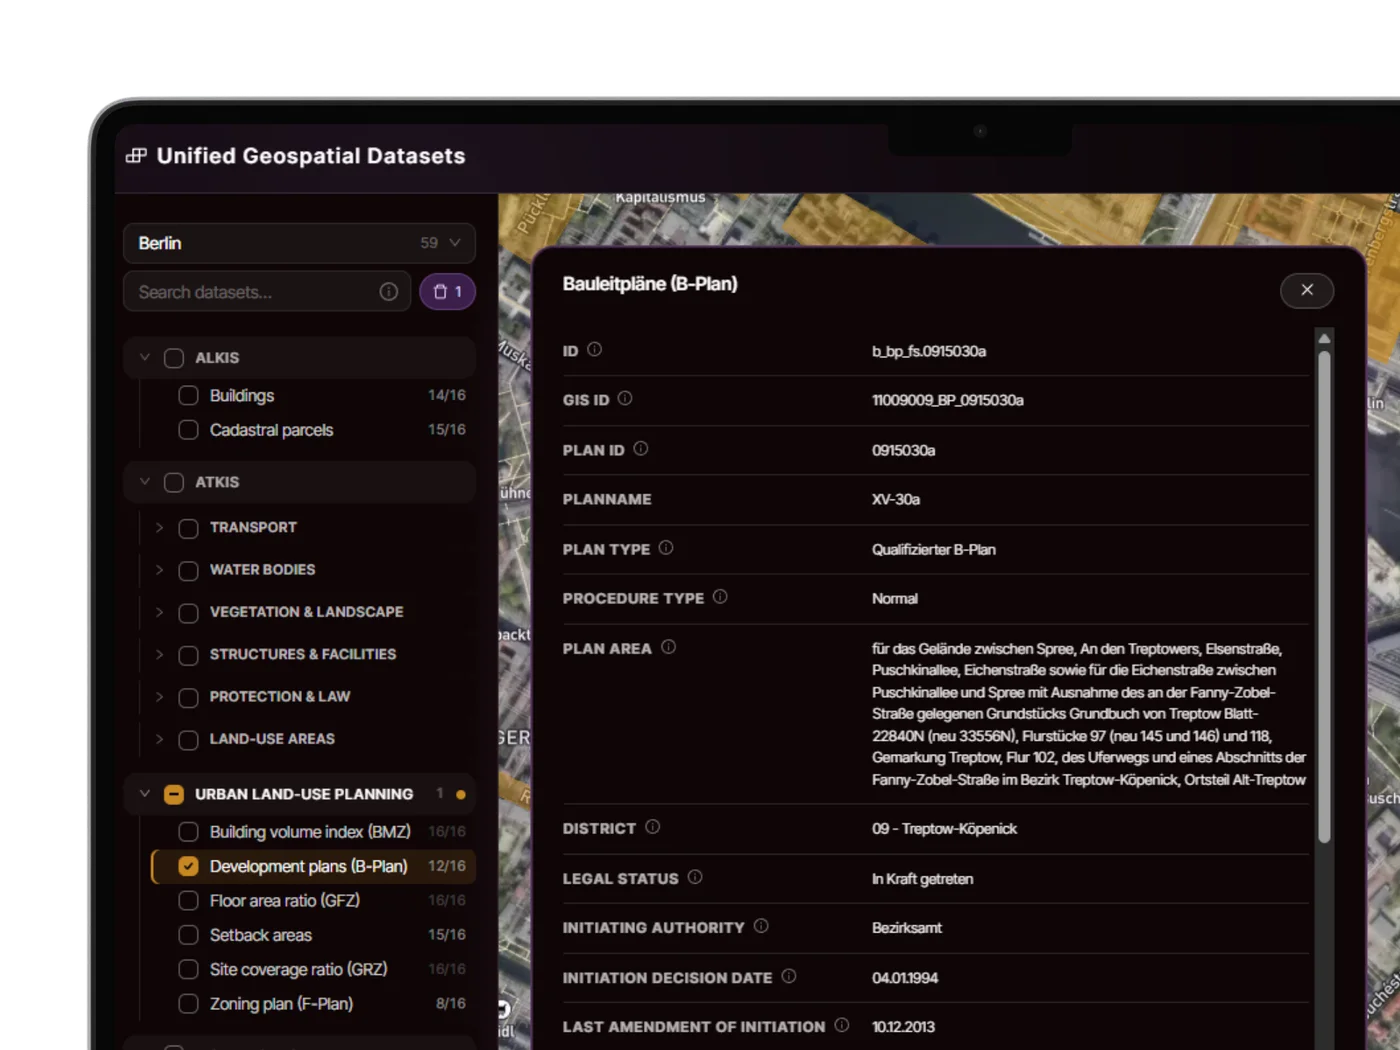
- Clicking any feature opens its full attribute panel exactly as published, with the source document one click away where one exists
- Search and a state or city selector narrow the map before you ever draw a shape, so a one-off question doesn't require setting up a query
- What you find can be exported directly from Explorer, click and download; for a workflow your team runs often, Mapular's custom development can turn it into a purpose-built tool instead
Most questions about German geodata are not "give me a pipeline," they're "does this one thing exist, and what does it actually say." Is there a Bebauungsplan for this parcel, and what does it permit? What's this building's LOD2 height? Is this address inside a flood hazard zone? Mapular Explorer exists for exactly that shape of question: instant, in a browser, with no GIS project to set up and no schema to learn before you can look at the first result.
What is Mapular Explorer?
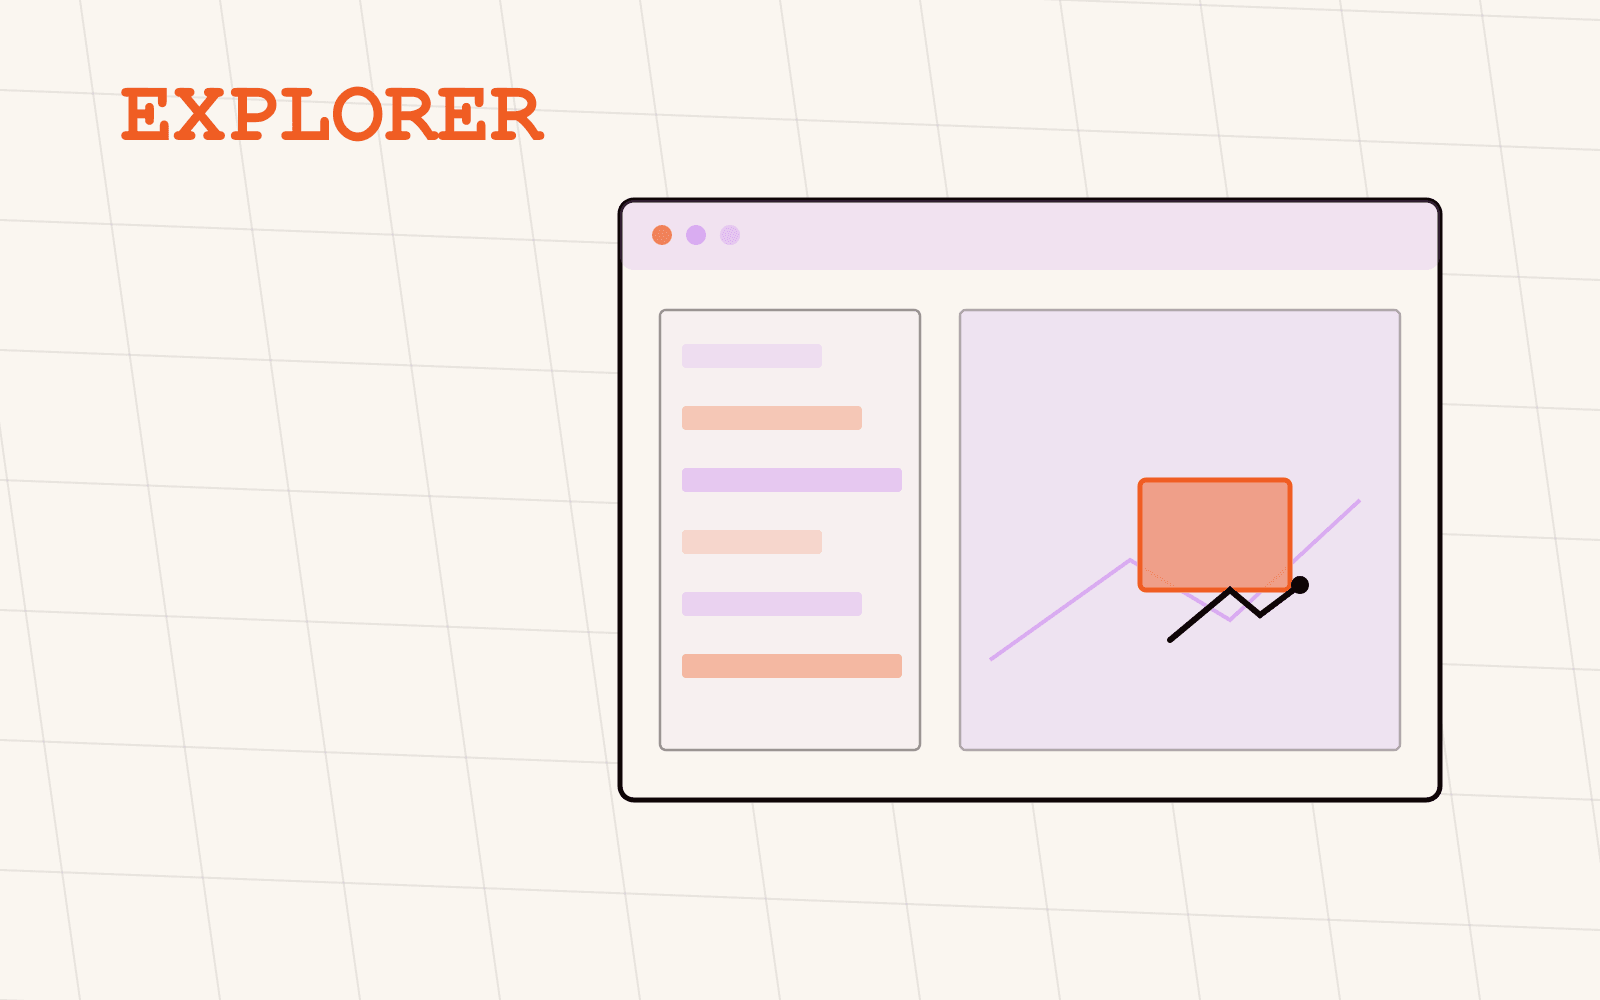
Mapular Explorer is the browser-based way to see Mapular's harmonised geodata model directly, layer by layer, feature by feature, without setting up a GIS project or writing a single query. It sits next to the GIS/CAD/BI-ready delivery route as the second of the two ways to access the same data: one route ships the model into your own tools over standard formats, the other lets you look at it directly.
That "same model" part matters. Explorer is not a marketing demo running on a sample extract. Every dataset you can toggle in Explorer is the same harmonised layer documented in the geospatial data catalog, with the same per-state coverage and the same attribute schema, just rendered for browsing instead of piped into your own stack.
What data can you actually see and download in it?
The dataset list in Explorer is organised the same way the catalog is: by category, not by state, which matters because the same category covers all 16 federal states, with completeness shown per category before you start looking rather than discovered by trial and error.
- ALKIS: cadastral parcels and buildings from Germany's official real-estate cadastre
- ATKIS: topographic base data across transport, water bodies, vegetation and landscape, structures and facilities, protection and law, and land-use areas
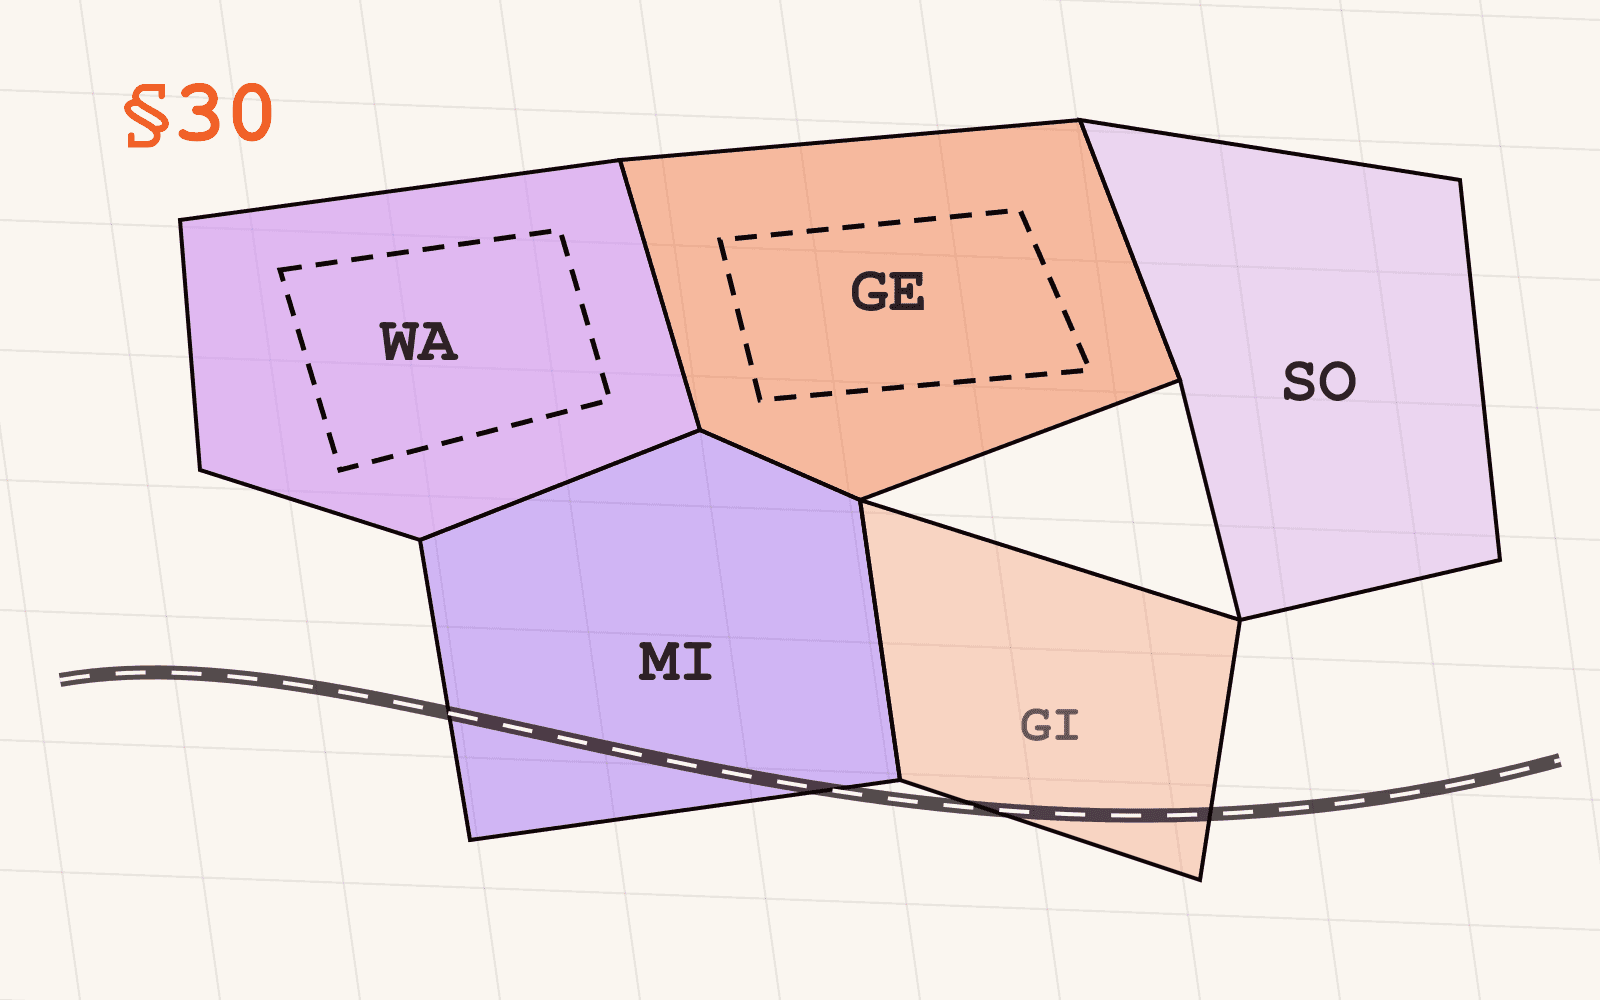
- Urban Land-Use Planning: Development plans (Bebauungspläne), Zoning plans (Flächennutzungspläne), and Setback areas (Abstandsflächen)
- Risk & Zones: flood and inundation zones, earthquake zones, snow load zones, wind load zones, subsoil classes and drinking water protection areas
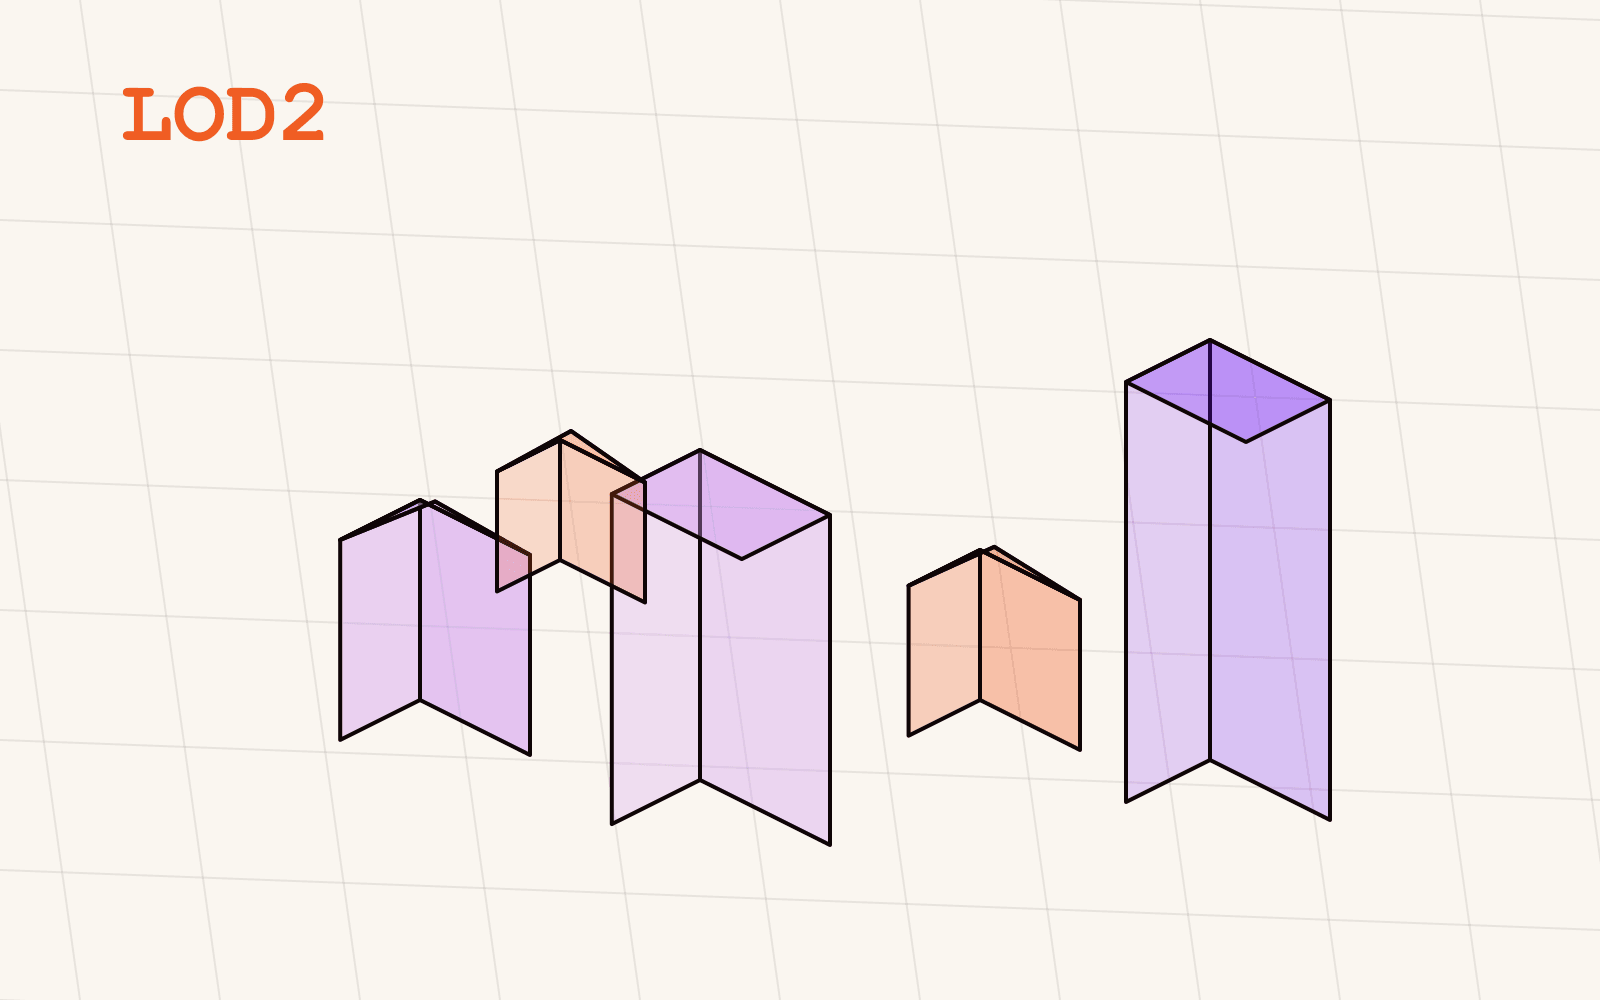
- Elevation & 3D: the digital terrain model and LOD2 3D building models
- Demographics: national population and labour-market indicators, in the same model as the spatial layers
Every category shows a completeness count against the 16 states before you commit to a search, so a gap reads as a gap rather than a silent empty result.
Can you download what you find?
Yes. A feature, a filtered layer, or a small shortlist can be exported directly from the browser, no separate download portal, no request form to fill in first. Look, click, export, that's the whole workflow for a one-off check or a handful of sites.
For anything beyond that, a process that runs on a schedule, or a system that needs the data automatically, see the next section: Explorer covers the occasional lookup, and there are two different routes for the repeatable ones.
What happens when you click on a feature?
This is where Explorer earns its place over a static export. Clicking a Bebauungsplan polygon, for instance, opens an attribute panel with every field the plan carries: plan ID, plan name, plan type (a qualified vs. simple B-Plan reads differently in law), procedure type, the plan area's legal description, district, legal status, initiating authority, and the full timeline of decision and amendment dates. Nothing here is summarised or trimmed; it's the harmonised record, in full, with a reference back to the publishing authority so it can be verified at the source if needed.
The same pattern holds across layers. A parcel shows its Flurstückskennzeichen and area. A LOD2 building shows its height attributes. A flood zone shows its hazard class. One interaction model, applied consistently across every dataset Explorer carries, which is exactly what makes it usable for someone checking one site at a time rather than someone who already knows the schema by heart.
Who is Explorer for, and what do you use instead for repeatable work?
Explorer is built for the moment a question arrives faster than a pipeline could answer it: a planner checking one parcel before a call, an analyst spot-verifying a hazard class, anyone who needs to look at three sites this afternoon rather than integrate a data source this quarter. No GIS setup, no API credentials, no schema documentation to read first.
The moment that question repeats, though, or turns into a screening rule you want to run every week, or needs to sit inside a model alongside your own portfolio data, Explorer stops being the right tool on its own, not because it's limited, but because a browser tab isn't how you run a repeatable process. If what you actually need is the raw data flowing into a system you already run, that's what the GIS, CAD or BI-ready delivery is for: the same schema, the same coverage, through a REST API with its own filter parameters, and downloads in GeoJSON, Shapefile, GeoParquet or other formats. But a real screening workflow, parcels above a size threshold, no existing building, zoning that actually permits the use, is more than a filter parameter can express on its own. For a known, recurring check like that, Mapular's custom development builds the actual filter logic directly into Explorer, so the workflow becomes a saved view your team reuses instead of a manual walk-through repeated by hand.
Screening for buildable, undeveloped land in Germany walks through exactly that kind of workflow, parcel size, population thresholds and zoning permissibility combined into one filter, as a concrete example of what gets built this way.
Where to go from here
If you want to see what's actually in the model before deciding which access route fits, the geospatial data catalog lists every layer Explorer can show you, with exact per-state coverage stated up front.