Das Wichtigste in Kürze:
- Hochwassergefahrenkarten stammen aus der EU-Hochwasserrichtlinie (2007/60/EG), umgesetzt über § 74 WHG; sie modellieren Hochwasserszenarien nach Wahrscheinlichkeitsklasse und sind informativ, keine rechtliche Festsetzung
- Überschwemmungsgebiete werden per Landesverordnung nach § 76 WHG festgesetzt, und § 78 WHG knüpft an diese Grenze verbindliche Baubeschränkungen
- Ein Standort kann in einem Gefahrenszenario liegen, ohne in einem festgesetzten Überschwemmungsgebiet zu liegen, und umgekehrt; wer nur eines der beiden prüft, übersieht reales Risiko
- Die Abdeckung unterscheidet sich je Layer: Hochwassergefahrenflächen liegen für 13 von 16 Bundesländern vor (Bayern, Sachsen-Anhalt und Thüringen veröffentlichen nicht an der Quelle), Überschwemmungsgebiete für eine andere Auswahl von 13 (Baden-Württemberg, Bayern und Sachsen-Anhalt veröffentlichen nicht an der Quelle)
- Zusammen beantworten beide Layer die zwei Fragen, die eine Bank oder ein Versicherer tatsächlich stellt: Wie exponiert ist der Standort, und ist Bauen hier rechtlich beschränkt?
Wenn in einer Due-Diligence-Mappe für einen deutschen Standort "Hochwasserrisiko: ja" steht, lautet die nächste Frage: welche Art von Ja. Deutschland erzeugt zwei grundverschiedene Kategorien von Hochwasserdaten, und sie werden ständig verwechselt, weil beide das Wort "Hochwasser" tragen und beide als Polygone auf einer Karte auftauchen. Der Hochwassergefahren-Layer von Mapular deckt die eine Hälfte dieses Bilds ab, ein eigener Layer die andere. Dieser Beitrag erklärt, was jede Kategorie tatsächlich behauptet, warum der Unterschied für jeden zählt, der einen Standort freigibt, und wie Sie beide nutzen, ohne sie zu vermischen.
Welche Frage stellt eine Bank oder ein Versicherer eigentlich?
Fragen Sie einen Kreditgeber oder Versicherer, was er von "Hochwasserdaten" braucht, und Sie erhalten zwei Fragen in einer Anfrage gebündelt. Die erste ist eine Risikofrage: Wie wahrscheinlich erreicht Wasser diesen Standort, und wie schlimm könnte es werden? Die zweite ist eine Rechtsfrage: Liegt dieser Standort innerhalb einer Grenze, an die das Gesetz Baubeschränkungen knüpft?
Das ist nicht dieselbe Frage, und deutsche Hochwasserdaten beantworten sie nicht mit einem einzigen Datensatz. Eine Kategorie von Karten modelliert die erste Frage. Eine andere, rechtlich eigenständige Festsetzung beantwortet die zweite. Wer beide für austauschbar hält, riskiert einen Screening-Bericht, der entweder das Risiko an einem Standort ohne jede rechtliche Beschränkung überzeichnet oder eine Beschränkung an einem Standort übersieht, der nie ein Gefahrenszenario ausgelöst hat.
Was zeigen Hochwassergefahrenkarten tatsächlich?
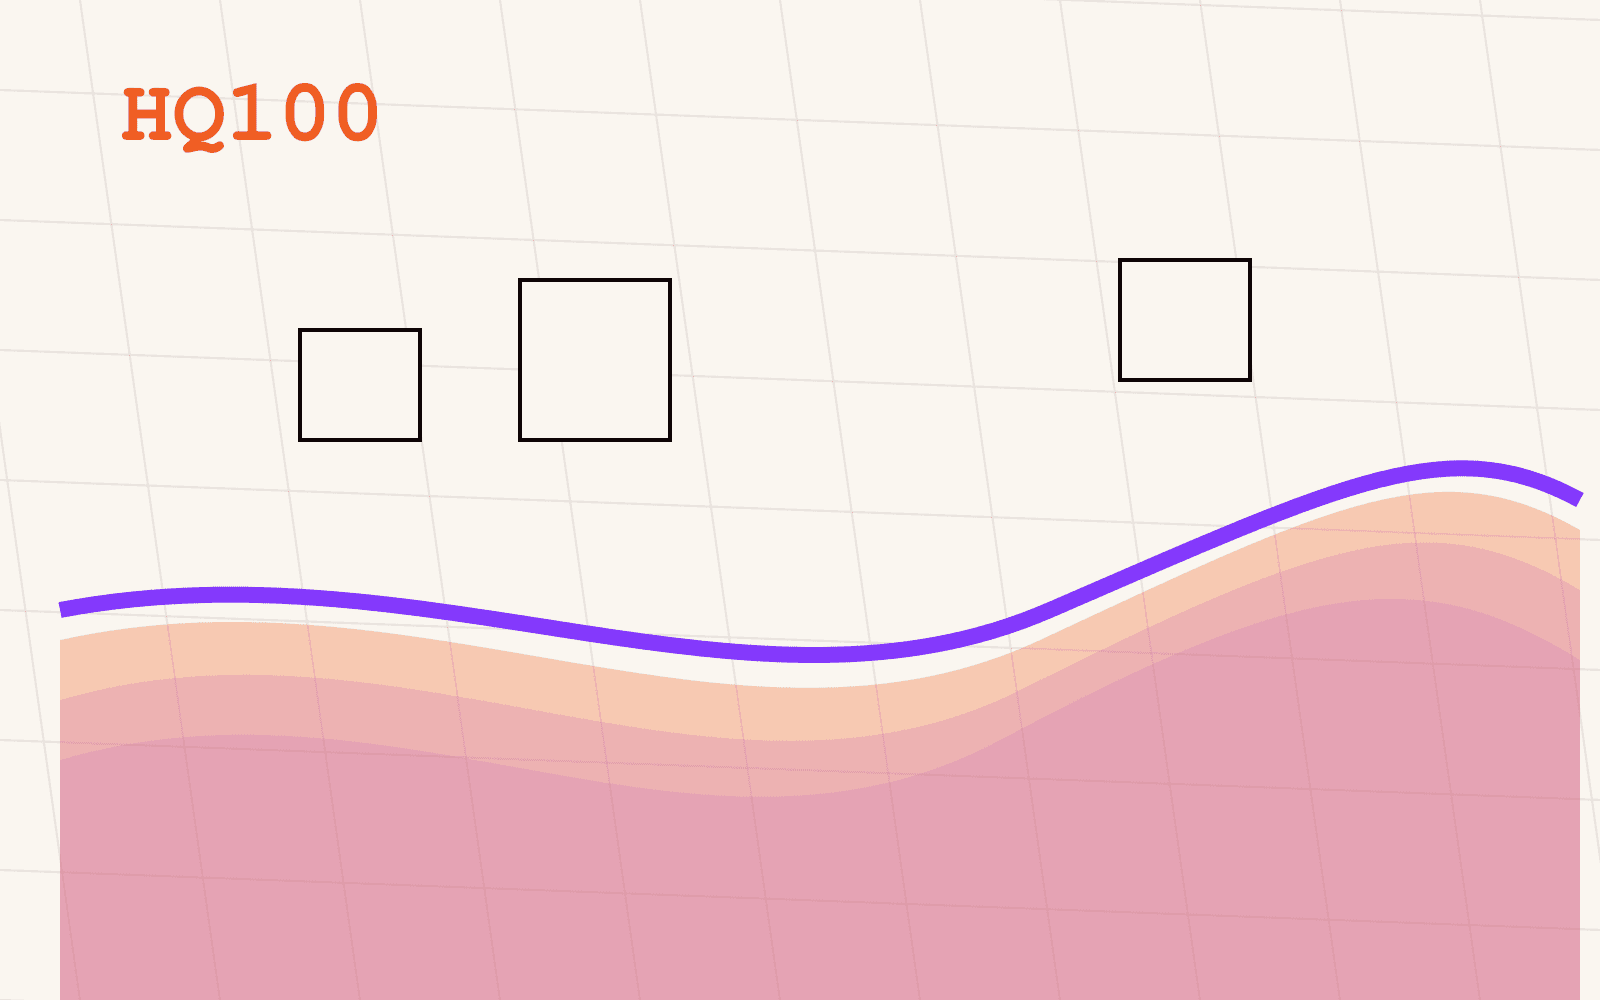
Hochwassergefahrenkarten werden von den Bundesländern nach der EU-Hochwasserrichtlinie (2007/60/EG) erstellt, umgesetzt über § 74 des Wasserhaushaltsgesetzes (WHG). Für jede Wahrscheinlichkeitsklasse modellieren die Karten, wie weit ein Hochwasser dieser Größenordnung reichen könnte. Die Klassen sind ein häufiges Szenario (hohe Wahrscheinlichkeit, oft im Bereich HQ10 bis HQ30), ein mittleres Szenario (typischerweise das hundertjährliche Hochwasser, HQ100) und ein Extremszenario mit niedriger Wahrscheinlichkeit (HQextrem).
Diese Modellierung ist bewusst informativ. Die Flächen lösen keine unmittelbaren Bauverbote aus. Ihr Gewicht ergibt sich daraus, wie Behörden, Versicherer und Finanzierer sie tatsächlich nutzen: Behörden ziehen die Karten in der Planung heran, Versicherer und Finanzierer nutzen die Szenarioklassen, um Exponierung abzustufen statt ein binäres Hochwasser-Flag zu setzen, und die Gefahrenflächen tauchen regelmäßig als Befund in Due-Diligence-Berichten auf. Ein Standort, den nur das Extremszenario berührt, ist ein anderer Befund als einer im häufigen Szenario, und genau diese Abstufung ist der Wert von drei Klassen statt eines binären Flags.
Der Hochwassergefahrenflächen-Layer von Mapular führt diese veröffentlichten Gefahrenflächen aus 13 von 16 Bundesländern zusammen, mit Szenarioklasse, Geometrietyp und Herkunftsland als Attribut an jedem Objekt, sodass eine Abfrage "häufig" von "extrem" unterscheiden kann, ohne den Kartenviewer eines Landes zu öffnen.
In der Praxis heißt das: Ein Portfolio lässt sich nach Szenarioklasse statt nach einem binären Hochwasser-Flag einordnen, Versicherer differenzieren Prämien und Exponierung anhand der amtlichen Klassen aus den Karten der EU-Hochwasserrichtlinie, und Planer stresstesten Standortentscheidungen am Extremszenario, bevor sie sich auf einen Standort festlegen. Jede dieser drei Nutzungen setzt voraus, dass die Szenarioklasse als Attribut vorliegt, nicht nur als eingefärbte Fläche auf einer Karte.
Was sind Überschwemmungsgebiete?
Überschwemmungsgebiete sind etwas grundlegend anderes. Sie werden nach § 76 WHG förmlich festgesetzt: Gebiete, die statistisch mindestens einmal in hundert Jahren überschwemmt werden oder für den Hochwasserrückhalt benötigt werden. Die Festsetzung erfolgt per Landesverordnung, und diese Verordnung macht die Grenze rechtsverbindlich, nicht modelliert.
Die Konsequenz ist § 78 WHG. Innerhalb eines festgesetzten Überschwemmungsgebiets untersagt § 78 die Ausweisung neuer Baugebiete und stellt die Errichtung baulicher Anlagen unter strengen Genehmigungsvorbehalt, typischerweise mit Auflagen wie hochwasserangepasstem Bauen und Ausgleich verlorenen Rückhalteraums. Für Gebiete, die vor der förmlichen Festsetzung vorläufig gesichert sind, gelten dieselben Anforderungen entsprechend. Das ist kein Risikowert. Das ist ein Rechtsakt, mit dem Behörden, Gerichte und Genehmigungsverfahren direkt arbeiten.
Der Überschwemmungsgebiete-Layer von Mapular führt Festsetzungsstatus, Name, Gewässer und Herkunftsland an jedem Polygon, und genau das erlaubt einer Screening-Abfrage, "§ 78-belastet" als eigenständigen Befund zu markieren, statt ihn in einen allgemeinen Hochwasser-Risikowert zu falten.
Für ein Portfolio bedeutet das konkret: Alle Bestände lassen sich in einer Abfrage mit den festgesetzten Gebieten verschneiden, um § 78-belastete Flurstücke zu markieren; bei einer Transaktion dokumentiert der Festsetzungsstatus den Befund als Beleg; und in der Standortwahl zeigt sich eine verbindliche Baubeschränkung, bevor Planung, Genehmigungsbudget oder Grundstücksverhandlung beginnen, statt erst danach.
Warum kann ein Standort im einen liegen und nicht im anderen?
Weil beide Kategorien auf unterschiedlicher Logik beruhen, kann ein Standort in einem Gefahrenszenario liegen, ohne in einem festgesetzten Überschwemmungsgebiet zu liegen, und umgekehrt gilt das ebenso. Ein Flurstück kann innerhalb des Extremszenarios (HQextrem) liegen, das informativ ist und unmittelbar nichts vorschreibt, während es vollständig außerhalb jedes festgesetzten Überschwemmungsgebiets liegt, also keine § 78-Beschränkung gilt. Umgekehrt kann ein Flurstück innerhalb eines festgesetzten Überschwemmungsgebiets liegen, mit dem vollen Gewicht des § 78 WHG, selbst wenn das Gefahrenszenario der Karte für diesen Flussabschnitt je nach den eigenen Modellierungskonventionen des Landes konservativ oder großzügig gezeichnet wurde.
Für einen Screening-Workflow heißt das: Wer nur den Gefahren-Layer prüft, kann eine verbindliche rechtliche Beschränkung übersehen, und wer nur den Layer der festgesetzten Gebiete prüft, kann ein reales Expositionssignal übersehen, das noch nicht in eine Verordnung überführt wurde. Kein Layer ersetzt den anderen. Eine gründliche Standortprüfung läuft mit beiden.
Warum decken deutsche Hochwasserdaten nicht alle 16 Bundesländer ab?
Beide Layer tragen dieselbe strukturelle Lücke aus demselben Grund: Veröffentlichung ist Ländersache, und nicht jedes Land veröffentlicht.
Hochwassergefahrenflächen liegen für 13 von 16 Bundesländern vor. Bayern, Sachsen-Anhalt und Thüringen veröffentlichen ihre Hochwassergefahrenflächen nicht an der Quelle. Überschwemmungsgebiete liegen ebenfalls für 13 von 16 Ländern vor, aber nicht für dieselben 13: Baden-Württemberg, Bayern und Sachsen-Anhalt veröffentlichen ihre festgesetzten Überschwemmungsgebiete nicht an der Quelle. Bayern und Sachsen-Anhalt fehlen bei beiden Layern. Thüringen fehlt nur beim Gefahren-Layer. Baden-Württemberg fehlt nur beim Layer der festgesetzten Gebiete.
Genau diese Asymmetrie ist der Grund, warum beide Datensätze als getrennte Layer geprüft werden müssen, statt anzunehmen, sie liefen im Gleichschritt. Mapular benennt jede Lücke offen auf der jeweiligen Layer-Seite, statt sie mit modellierten Ersatzdaten zu füllen, die nicht der amtlichen Quelle entsprächen, mit der die Behörden selbst arbeiten. Ein Datensatz, der für rechtliche oder underwriting-relevante Zwecke genutzt wird, muss auf das rückführbar bleiben, was ein Land tatsächlich veröffentlicht hat, auch wenn das bedeutet, "hier nicht verfügbar" zu sagen.
Wie prüfen Sie mit beiden Layern als einem Modell?
In der Praxis beantworten die beiden Layer sich ergänzende Teile derselben Portfoliofrage. Prüfen Sie zuerst mit dem Layer der festgesetzten Gebiete, ob ein Standort innerhalb eines festgesetzten oder vorläufig gesicherten Überschwemmungsgebiets liegt: Dieses Ergebnis ist ein verbindlicher rechtlicher Befund, Ja oder Nein, und gehört als solcher in einen Due-Diligence-Bericht. Prüfen Sie dann mit dem Gefahren-Layer dasselbe Portfolio nach Szenarioklasse, häufig, mittel oder extrem, was aus der Frage "Gibt es Hochwasserrisiko?" eine abgestufte Antwort statt einer Ja/Nein-Vermutung macht.
Kombiniert kann eine Abfrage für jeden Standort beantworten: Ist er nach § 78 rechtlich beschränkt, und getrennt davon, wie exponiert ist er nach den Szenarien der EU-Hochwasserrichtlinie? Das ist genau die Form der Frage, die eine Bank oder ein Versicherer tatsächlich stellt, wenn "Hochwasserdaten" angefordert werden, und deshalb liegen beide Layer in Mapulars Paket Planung & Baurecht, zusammen mit den übrigen hochwasserrelevanten Referenz-Layern im Geodatenkatalog.
Wie geht es weiter?
Wenn Ihre Hochwasserprüfung heute bedeutet, pro Bundesland eine PDF-Karte zu öffnen und per Auge zu prüfen, ob ein Flurstück in einer schattierten Zone liegt, besteht die Lösung darin, beide Kategorien als abfragbare Daten zu behandeln statt als Dokumente. Beginnen Sie mit der Hochwassergefahren-Layer-Seite: Dort stehen die Szenarioklassen, die Abdeckung je Bundesland, und wie Sie Beispieldaten anfordern, um das Schema gegen Ihren eigenen Workflow zu prüfen, bevor Sie mit irgendjemandem über einen Vertrag sprechen.