Your building's heating system will not last forever. When it is time to replace it, could a shared heat network become an option, or will the building need its own solution? And what can a citywide plan tell you about your particular street?
Those questions are the starting point for Will my heating change? Berlin's heat plan, an interactive story we built with ArcGIS StoryMaps and Berlin's open geodata. It brings maps, charts and 3D views together to explain how the city uses heat today and what its published plan anticipates through 2045.
Berlin adopted its first citywide heat plan in June 2026. The official plan identifies areas with different heating prospects, including existing heat networks, potential expansion, decentralised supply and areas requiring further investigation. Reading those categories on a map is one thing. Understanding what they could mean for the place you live is another.
Explore the StoryMap
Scroll inside the story below to move from Berlin's citywide heat demand to individual neighbourhoods. Compare the planning outlook across the reference years from 2025 to 2045, explore street-level views around Alexanderplatz and the Hufeisensiedlung, and use the interactive maps to look more closely at an area that interests you.
The embedded story is in English. For more room on a phone, or to explore the maps in a separate window, open the StoryMap directly.
What the maps can tell you
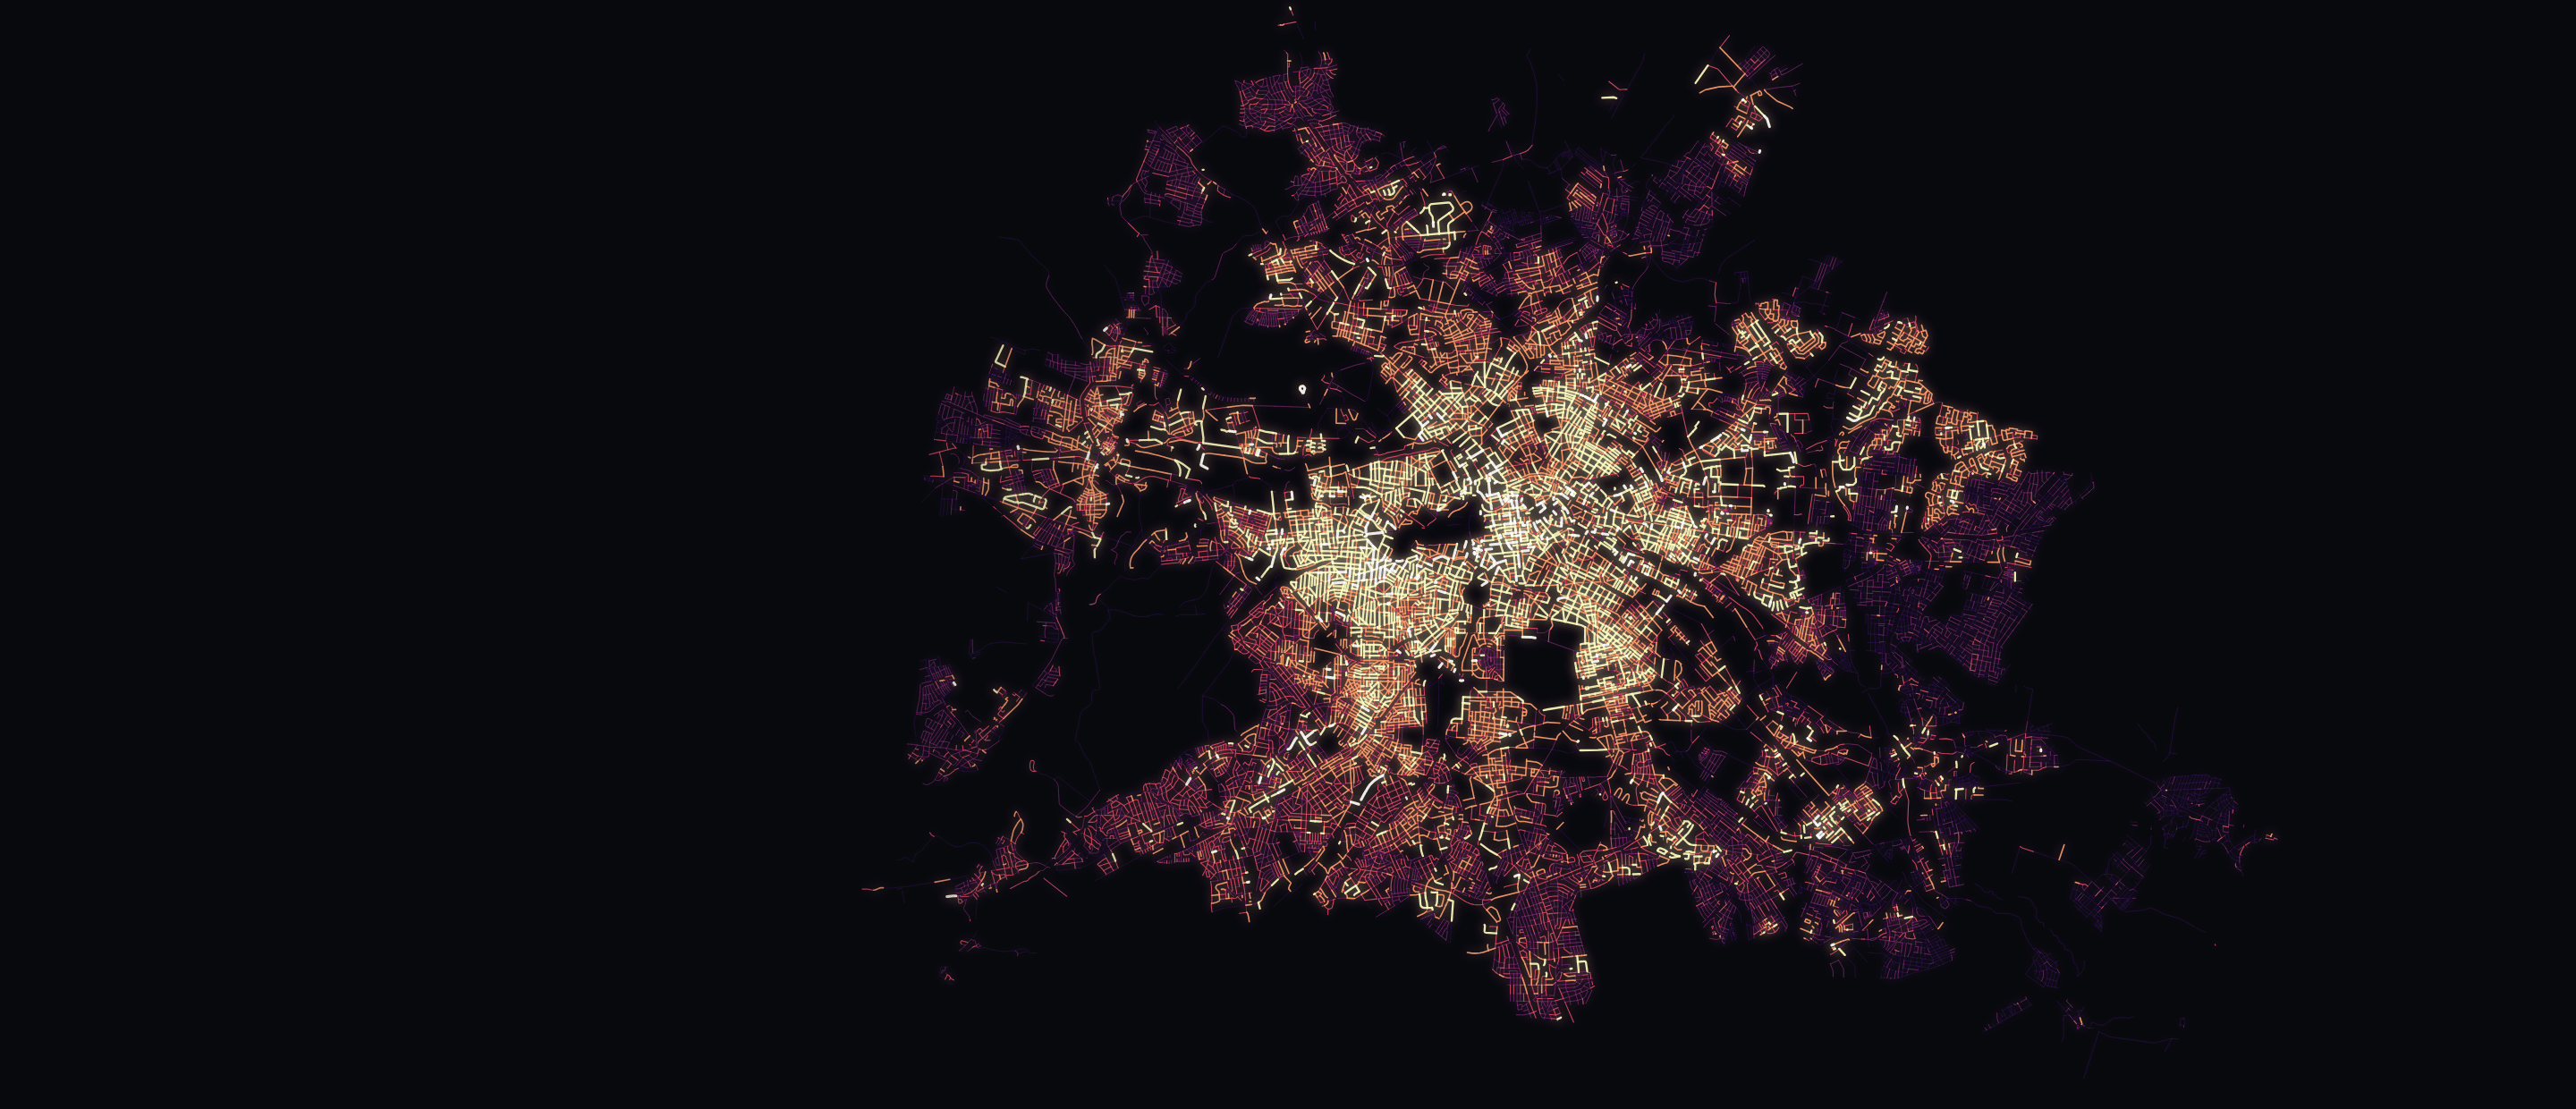
The story starts with the geography of heat demand. Dense development and areas of concentrated consumption help explain why a shared network may be worth investigating in one place while individual building systems may make more sense elsewhere.
The 3D views make that geography easier to read. In the citywide view, raised blocks represent heat consumption rather than the physical height of buildings. The detailed neighbourhood views use building models to bring the planning categories into a recognisable setting.
The future-year maps show planning prospects, not a construction timetable. A network expansion area does not guarantee that a particular building will be connected by the year shown. Likewise, an existing-network area does not mean that every building within it already has a connection. The story keeps those distinctions visible alongside the maps.
For a building-specific decision, use the official Berlin guidance and contact the relevant network operator. The Wärmewendeagentur offers independent information and advice on heating options.
From planning data to a story about your street
We built this as an independent Mapular demonstration of geographic storytelling. It is not an official Berlin service or a commissioned project for the city. The underlying planning information comes from Berlin's published data; our contribution is the sequence, visual presentation and explanation that help readers make sense of it.
The main source is the Berlin heat-planning dataset, published under CC BY 4.0 with attribution to Geoportal / Wärmeplanung. The story includes source notes for the other geographic layers and visual assets. Published planning results are aggregated and do not provide a complete record for every individual building.
For us, a useful public map starts with a question someone actually has. Here, that question is about the future of their street. The maps provide the evidence, while the narrative explains what can be learned from it and where a reader can go next.
If you are working with a planning dataset that needs to reach a wider audience, see our ArcGIS services or talk to us about your project.