Ob Filialnetz, Gastronomie, Praxis oder Franchise-System: Kaum eine Entscheidung ist so teuer zu korrigieren wie ein falscher Standort. Mietverträge laufen Jahre, Umbauten kosten sechsstellige Beträge, und ein Standort mit zu wenig Nachfrage lässt sich durch gutes Marketing nur begrenzt retten.
Eine saubere Standortanalyse senkt dieses Risiko drastisch. Sie ersetzt Bauchgefühl durch überprüfbare Daten: Wer lebt und arbeitet im Einzugsgebiet? Wie viel Kaufkraft ist vorhanden? Wer ist bereits vor Ort? Und wie viel Frequenz kommt tatsächlich an der Fläche vorbei?
Dieser Leitfaden zeigt, wie eine fundierte Standortanalyse aufgebaut ist, welche Methoden und Datenquellen sich bewährt haben und welche Tools dafür in Frage kommen.
Was ist eine Standortanalyse?
Eine Standortanalyse ist die systematische Bewertung eines Standorts anhand messbarer Kriterien: Demografie, Kaufkraft, Wettbewerb, Erreichbarkeit und Passantenfrequenz. Das Ziel ist eine belastbare Antwort auf zwei Fragen:
- Expansion: Welcher von mehreren möglichen Standorten hat das größte Umsatzpotenzial?
- Bestand: Warum performt ein bestehender Standort besser oder schlechter als erwartet, und was folgt daraus für das Netz?
Typische Anwender sind Einzelhändler, Gastronomie- und Franchise-Systeme, Projektentwickler, Banken und Versicherungen mit Filialnetzen sowie Kommunen bei der Ansiedlungsplanung.
Die fünf wichtigsten Methoden
In der Praxis kombiniert eine gute Standortanalyse mehrere Bausteine. Die fünf wichtigsten:
1. Einzugsgebietsanalyse
Das Einzugsgebiet beschreibt, aus welchem Umkreis ein Standort realistisch Kunden anzieht. Statt einfacher Radien haben sich Fahrzeit-Isochronen durchgesetzt: Zonen, die abbilden, welche Gebiete in 5, 10 oder 15 Minuten mit dem Auto, zu Fuß oder mit dem ÖPNV erreichbar sind. Ein Standort an einer Ausfallstraße hat ein völlig anderes Einzugsgebiet als einer in einer Fußgängerzone, auch wenn beide auf der Karte nur zwei Kilometer auseinanderliegen.
2. Zielgruppen- und Kaufkraftanalyse
Innerhalb des Einzugsgebiets zählt, wer dort lebt: Altersstruktur, Haushaltsgrößen, Einkommen und sortimentsspezifische Kaufkraft. So lässt sich das theoretische Marktpotenzial eines Standorts beziffern und mit anderen Standorten vergleichen.
3. Wettbewerbsanalyse
Wie viele Wettbewerber sind im Einzugsgebiet aktiv, wo genau, und wie stark überschneiden sich ihre Einzugsgebiete mit dem geplanten Standort? Wichtig ist der Blick auf beide Seiten: Hohe Wettbewerbsdichte kann Verdrängung bedeuten, aber auch einen etablierten Konsumschwerpunkt anzeigen, von dem alle profitieren (Agglomerationseffekt).
4. Frequenz- und Erreichbarkeitsanalyse
Passantenfrequenz, Verkehrsströme und ÖPNV-Anbindung entscheiden darüber, wie viel vom theoretischen Potenzial tatsächlich an der Tür ankommt. Für frequenzabhängige Konzepte (Gastronomie, Convenience, Textil) ist dieser Baustein oft wichtiger als die reine Kaufkraft.
5. Scoring- und Gravitationsmodelle
Wer regelmäßig Standorte bewertet, standardisiert die Kriterien in einem Scoring-Modell: Jeder Standort erhält für Kaufkraft, Frequenz, Wettbewerb und Erreichbarkeit gewichtete Punktwerte und wird dadurch vergleichbar. Fortgeschrittene Ansätze wie Gravitationsmodelle (etwa nach Huff) schätzen zusätzlich, mit welcher Wahrscheinlichkeit Kunden einen Standort gegenüber Alternativen wählen. Wie wir solche Modelle für Expansionsentscheidungen einsetzen, zeigt unser Beitrag über Opportunity Mapping für wachsende Franchise-Systeme.
Welche Daten braucht eine Standortanalyse?
Die Qualität der Analyse steht und fällt mit den Daten. Für den deutschen Markt haben sich diese Quellen etabliert:
- Amtliche Statistik: Zensus und kleinräumige Bevölkerungsdaten liefern Altersstruktur und Haushaltsgrößen bis auf Gitterzellen- oder Postleitzahlebene.
- Kaufkraftdaten: Kommerzielle Anbieter veröffentlichen jährlich Kaufkraftkennziffern je Postleitzahl und Sortiment. Sie sind der Standard für Marktpotenzialrechnungen.
- POI- und Wettbewerberdaten: Points of Interest aus offenen Quellen wie OpenStreetMap und Overture, ergänzt um eigene Recherche, bilden die Wettbewerbslandschaft ab. Wie sich daraus verwertbare Datensätze bauen lassen, beschreibt unsere Lösung für Geodaten-Pipelines.
- Frequenz- und Mobilitätsdaten: Passantenzählungen, Mobilfunk- oder GPS-basierte Bewegungsdaten zeigen, wie viele Menschen tatsächlich am Standort vorbeikommen. Mehr dazu in unserem Beitrag über Foot-Traffic-Daten für Wettbewerbsanalysen.
- Eigene Kundendaten: Für Bestandsnetze sind die eigenen Transaktions- und Kundendaten die wertvollste Quelle. Sie zeigen, woher die Kunden real kommen, und kalibrieren jedes Modell besser als jede externe Statistik.
Der Prozess: Standortanalyse in fünf Schritten
- Kriterien definieren. Was macht für Ihr Konzept einen guten Standort aus? Mindestbevölkerung im Einzugsgebiet, Ziel-Kaufkraft, maximale Wettbewerbsdichte, Frequenzschwellen.
- Daten zusammenführen. Demografie, Kaufkraft, POIs und Frequenz auf eine gemeinsame räumliche Basis bringen (Gitterzellen, PLZ oder Isochronen).
- Einzugsgebiete modellieren. Für jeden Kandidaten Fahrzeit-Isochronen rechnen und das Potenzial im Gebiet aggregieren.
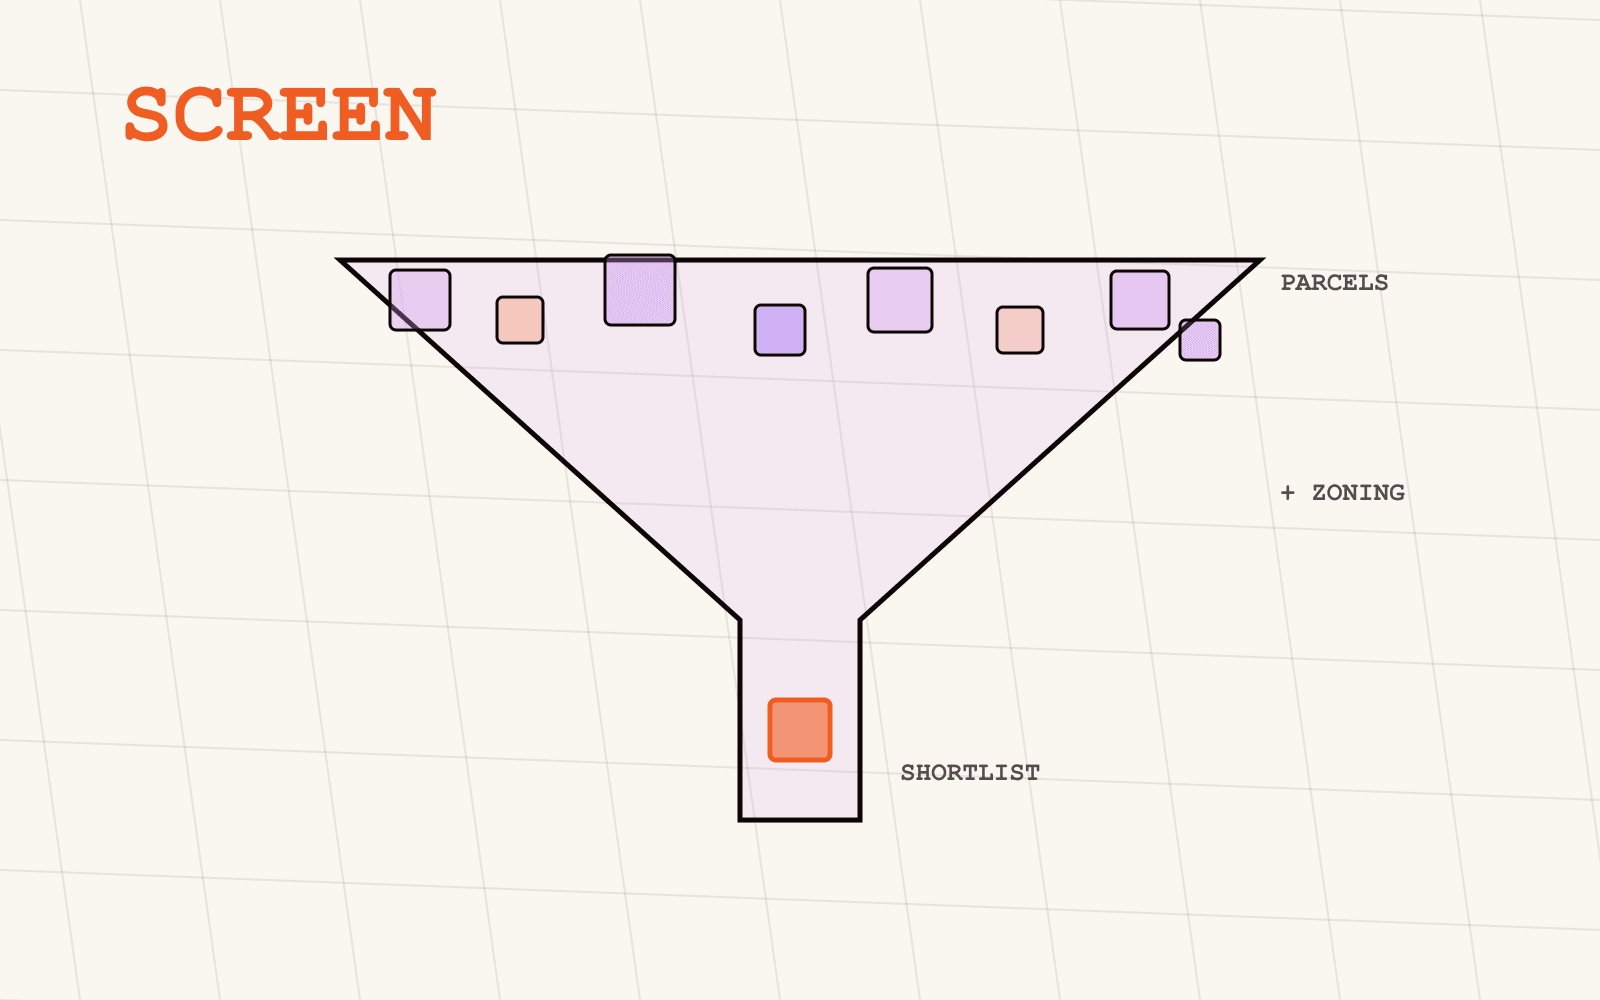
- Standorte scoren und vergleichen. Kandidaten anhand der definierten Kriterien bewerten, Rangfolge bilden, Sensitivitäten prüfen.
- Vor Ort validieren. Kein Modell ersetzt die Begehung: Sichtbarkeit der Fläche, Parksituation, Nachbarschaft und baulicher Zustand fließen als Korrektiv ein.
Wie das in der Praxis aussieht, zeigt unsere Fallstudie zur Expansionsplanung im stationären Einzelhandel mit KWIO.
Tools für die Standortanalyse
GIS-Software (QGIS, ArcGIS): Maximale Flexibilität für Geodaten-Profis. QGIS ist kostenlos, ArcGIS der Enterprise-Standard. Beide setzen GIS-Know-how voraus und sind für Fachfremde schwer zugänglich; die Datenbeschaffung bleibt komplett beim Anwender.
Excel plus Kartendienst: Der pragmatische Einstieg für eine Handvoll Standorte. Stößt schnell an Grenzen, sobald Isochronen, kleinräumige Daten oder wiederholbare Vergleiche gebraucht werden.
Spezialisierte Standortanalyse-Plattformen: Plattformen wie die Mapular Platform bündeln Demografie-, Kaufkraft- und POI-Daten mit fertigen Analysebausteinen wie Isochronen, Einzugsgebietsvergleichen und Scoring. Der Vorteil: Fachabteilungen wie Expansion oder Vertrieb arbeiten direkt damit, ohne GIS-Team, und die Datenbasis wird mitgeliefert und aktuell gehalten.
Individuelle Lösungen: Wenn Standortbewertung zum Kerngeschäft gehört (etwa bei Projektentwicklern oder größeren Filialisten), lohnt sich oft ein maßgeschneidertes Analyse-Setup mit eigenen Modellen und Datenpipelines. Solche Lösungen bauen wir als individuelle Geo-Anwendungen auf.
Häufige Fehler bei der Standortanalyse
- Radien statt Isochronen: Ein 5-km-Radius ignoriert Flüsse, Bahntrassen und Verkehrsführung. Erreichbarkeit schlägt Luftlinie.
- Kaufkraft ohne Frequenz (und umgekehrt): Ein kaufkraftstarkes Wohngebiet nützt einem frequenzgetriebenen Konzept wenig, eine hochfrequente Lage ohne passende Zielgruppe ebenso wenig.
- Wettbewerb nur als Risiko lesen: Konsumschwerpunkte entstehen durch Agglomeration. Die Frage ist nicht "Ist Wettbewerb da?", sondern "Ist noch unbediente Nachfrage da?".
- Einmalige Analyse statt kontinuierlicher Bewertung: Einzugsgebiete, Wettbewerb und Frequenz ändern sich. Wer sein Netz laufend bewertet, erkennt Kannibalisierung und Chancen früher.
- Modell ohne Validierung: Bestandsstandorte sind der beste Testfall. Ein Scoring, das die eigenen Top- und Flop-Standorte nicht erklärt, braucht bessere Daten oder andere Gewichte.
Häufige Fragen zur Standortanalyse
Was kostet eine Standortanalyse? Die Spanne ist groß: Eine einzelne Gutachter-Analyse liegt je nach Tiefe meist im vierstelligen Bereich. Plattform-Lösungen rechnen sich vor allem dann, wenn regelmäßig Standorte bewertet werden, weil die Kosten pro Analyse mit jeder weiteren Bewertung sinken.
Wie lange dauert eine Standortanalyse? Mit vorbereiteter Datenbasis und Plattform-Unterstützung lassen sich Kandidaten in Stunden vergleichen. Klassische Einzelgutachten dauern typischerweise mehrere Wochen.
Kann ich eine Standortanalyse selbst durchführen? Für eine erste Einschätzung ja: Einzugsgebiet definieren, Bevölkerung und Wettbewerber recherchieren, Lage begehen. Für belastbare Investitionsentscheidungen brauchen Sie kleinräumige Kaufkraft- und Frequenzdaten sowie saubere Isochronen, und damit entweder GIS-Kompetenz oder eine spezialisierte Plattform.
Welche Daten sind am wichtigsten? Das hängt vom Konzept ab. Frequenzgetriebene Formate (Gastronomie, Convenience) priorisieren Passantenfrequenz und Erreichbarkeit, zielgruppengetriebene Formate (Fachhandel, Dienstleistung) Demografie und Kaufkraft. In fast allen Fällen gilt: Die eigene Kundendatenbasis ist die wertvollste Quelle.
Fazit
Eine gute Standortanalyse ist kein einmaliges Gutachten, sondern ein wiederholbarer Prozess: klare Kriterien, kleinräumige Daten, Isochronen statt Radien und ein Scoring, das an den eigenen Bestandsstandorten validiert ist.
Wenn Sie Standortentscheidungen datenbasiert treffen wollen, ohne ein GIS-Team aufzubauen, schauen Sie sich die Mapular Platform für Standortanalysen an oder sprechen Sie mit uns über Ihren konkreten Fall.