The Challenge
When sunlight reflects off a solar panel it can create hazardous glare for road users, aircraft pilots, and people living nearby. In Germany, the Federal Immission Control Act (BImSchG) requires a formal glare assessment before larger photovoltaic installations can be approved. Similar regulations apply across most of Europe.
Glare is a three-dimensional problem. It depends on the angle of the panels, the path of the sun across the year, the height and position of every observer, and whether terrain or buildings block reflected light. Traditional assessments use 2D GIS tools and static diagrams that flatten all of this into something approvers can't intuit. Reports take weeks to produce and are hard for non-technical stakeholders to interpret or trust.
We needed a tool that handled the physics properly and made the result obvious to anyone looking at the screen.
The Solution
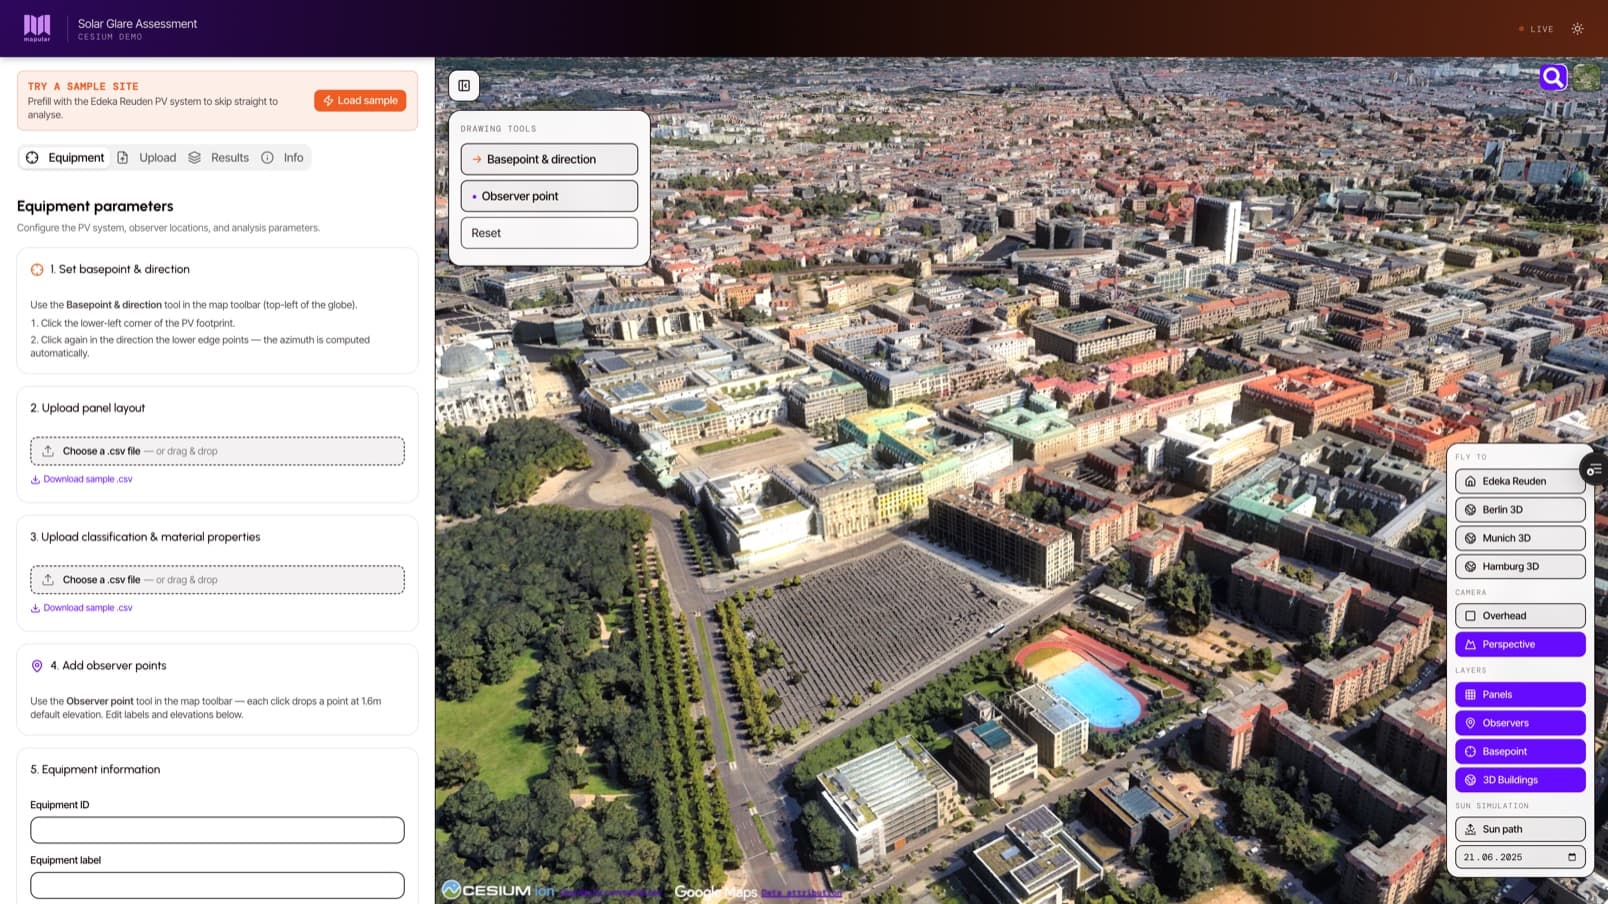
We built an interactive 3D web application. Users open it in any browser, navigate to the proposed installation site on a real-world globe with terrain and buildings, and place the panels and observer points directly on the map.
The 3D environment is physically accurate. The sun moves across the sky based on the actual date and location, terrain casts real shadows, and the user can scrub through the year to see how the geometry changes between seasons. Stakeholders looking at the screen can immediately see where glare is likely without needing an expert to interpret a chart.
Behind the scenes, the application runs a ray-tracing analysis that casts light from every panel surface toward every observer point, checks for obstructions, and matches reflected directions against the sun's known positions across the year. The full year of glare events is compiled into per-observer charts and a branded PDF report — downloadable from the Results tab with one click, ready to submit alongside the regulatory application.
Results & Impact
- Glare assessments that anyone can evaluate. The 3D view collapses what used to be a multi-page technical report into something a planning officer or neighbour can understand in seconds.
- Regulator-ready output. Every analysis run produces a downloadable PDF with the site map, observer summary, and per-observer glare timelines — packaged for direct submission.
- Faster turnaround. What previously took weeks of GIS work and back-and-forth now runs in minutes from a browser.
- Cesium Certified Developer status. Mapular is now listed in the official Cesium Certified Developer Directory, with this project as the showcase.
Key Takeaways
- If the problem is three-dimensional, the tool should be too. Compressing a 3D physical problem into 2D forces approximations that erode trust in the result. The harder a stakeholder has to work to interpret a diagram, the less weight they give it.
- Show the physics, don't hide it. The interactive sun-path and real-time shadows are the trust-building feature. People believe the analysis because they can see it happening.
- Close the loop with the deliverable the buyer actually needs. The 3D tool is impressive, but the asset that matters is the PDF that goes into the regulatory submission. Build the analysis to produce the final artefact, not just the intermediate visuals.